Job Monitoring
Monitoring indicates how many resources are utilized by the job.
Features
Monitoring: In the Job details, there is a Monitoring to show resource consumption metrics.
Resources It monitors three kinds of resources: CPU, Memory and GPUs.
Configuration
It could be enabled or disabled from helm value (the feature is enabled by default)
jobSubmission:
  monitoring:
    enabled: true
Design
User Journey
Monitor the running job
- A user submits a job and enter the job detail page.
- In the job page, switch to Monitoring tab, it will show the current cpu/gpu/memory metrics for a given of time. The metrics keep updating every 10 seconds.
- Click the different timespan (15min, 1hrs, 3hrs, lifetime) can switch to different timespan.
- Once the job is completed, stop updating and show the final metric state.
See the metrics for completed job
- Go to a completed job.
- Go to the Monitoring tab.
- It will show the latest cpu/gpu/memory metrics. And there are still different timespan to select.
See a warning when phfs is not enabled
- In the monitoring tab, see the message "feature not enabled, please contact admin", if underlying prerequisite (phfs) is not enabled.
Architecture
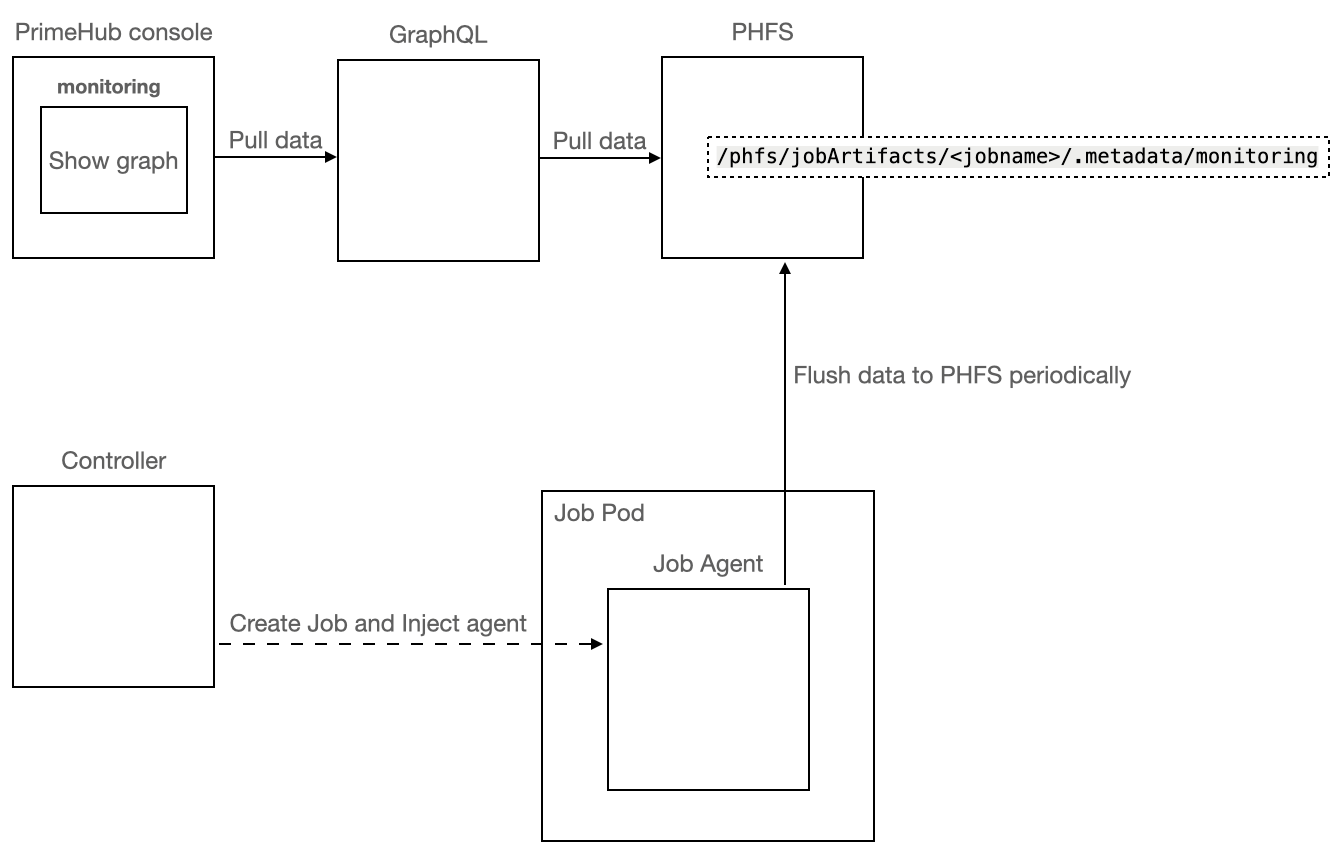
- For every running job, there would be a agent to collect the cpu/gpu/memory metrics
- Monitoring Page should refresh itself every 10 seconds.
- The agent periodically flush the current report to
/phfs/jobArtifacts/<jobname>/.metadata/monitoring. - The GraphQL has the report endpoint for the job to return current monitoring-report to client.
- The console periodically queries GraphQL to get the current metrics of the job.
Components
Agent
- Collect cpu/memory/gpu metrics.
- Keep the different interval metrics in the memory.
- Flush the monitoring metrics report to a file periodically (default
monitoringin working directory).
Controller
- Inject the agent to the job container in the init container.
- Run the agent at the start of the job in right working directory.
- Terminate(kill) the agent on the command is terminated.
GraphQL
- Query the report from store and return to client (add
monitoringfield in artifact resource)
Client
- Query GraphQL and render report periodically when running.
- Query GraphQL and render final report when completed.
Data Format
/phfs/jobArtifacts/<jobname>/.metadata/monitoring
- There are 4 timespans
15m,1h,3handlifetime - Each timespan has its interval of freshness.
- 15m: 10s → 15 * 60 / 10 = 90 points
- 1h: 30s → 60 * 60 / 30 = 120 points
- 3h: 2m → 3 * 60 * 60 / 120 = 90 points
- Lifetime: 5m → (4 weeks by default, configurable option in helm value)
- examples
- 1 day → 24 * 60 * 60 / 300 = 288 points
- 4 week → 4 * 7 * 24 * 60 * 60 / 300 = 8064 points
if 1 point uses 1k size, the bandwidth estimation will be
8064 / 1024 / 8 =
0.98 Mb/s
- examples