Grafana PrimeHub Dashboard
This document guides users to integrate Grafana with a existing PrimeHub by KeyCloak OIDC and install PrimeHub dashboard on Grafana. We will walk through
- Create a OIDC client for Grafana on KeyCloak.
- Modify the values file of the prometheus-operator Helm chart
- Install PrimeHub dashboard
What we assume?
In the following steps we assume:
- A KeyCloak with
primehubrealm; usually a installed PrimeHub includes the configuration. - PrimeHub domain is
example.primehub.ioand Grafana locates athttp://example.primehub.io/grafana - Use
nfs-clientas the storageClassName
Please modify settings to fit in the real circumstance.
Prometheus/Grafana
- Create OIDC client for Grafana on KeyCloak
- Install Prometheus-Operator
- Install primehub-grafana-dashboard
Create OIDC client for Grafana on KeyCloak
- Access KeyCloak management console: http://example.primehub.io/auth/admin/primehub/console, enter
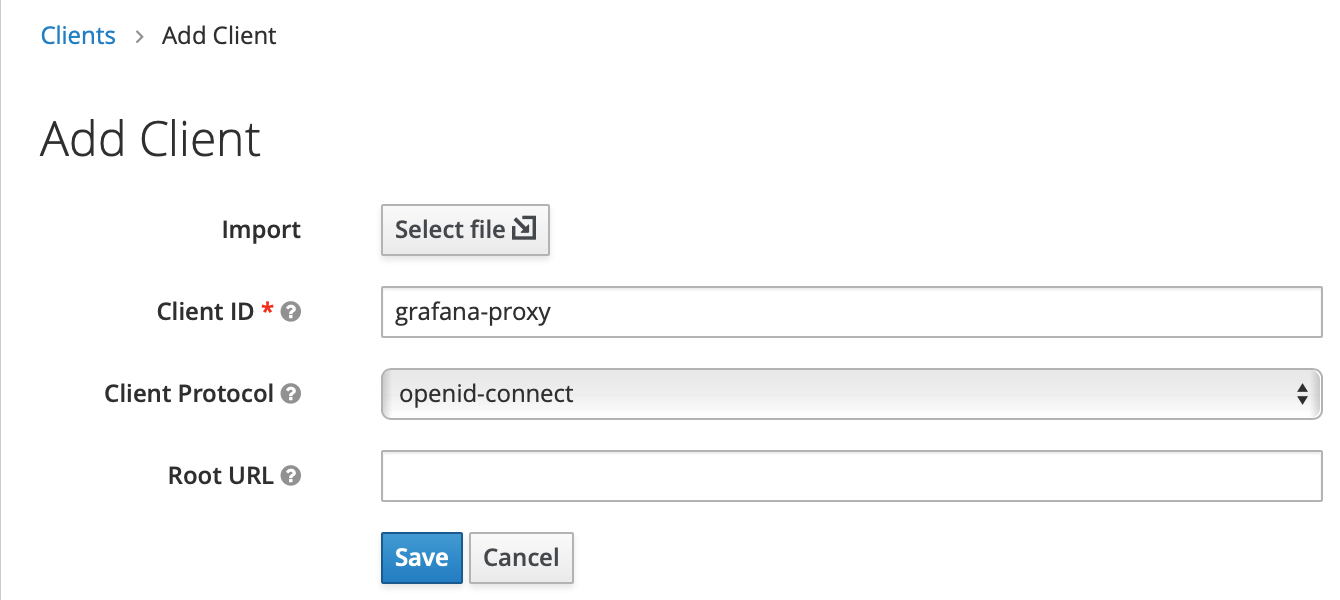
ClientsandCreatea client.
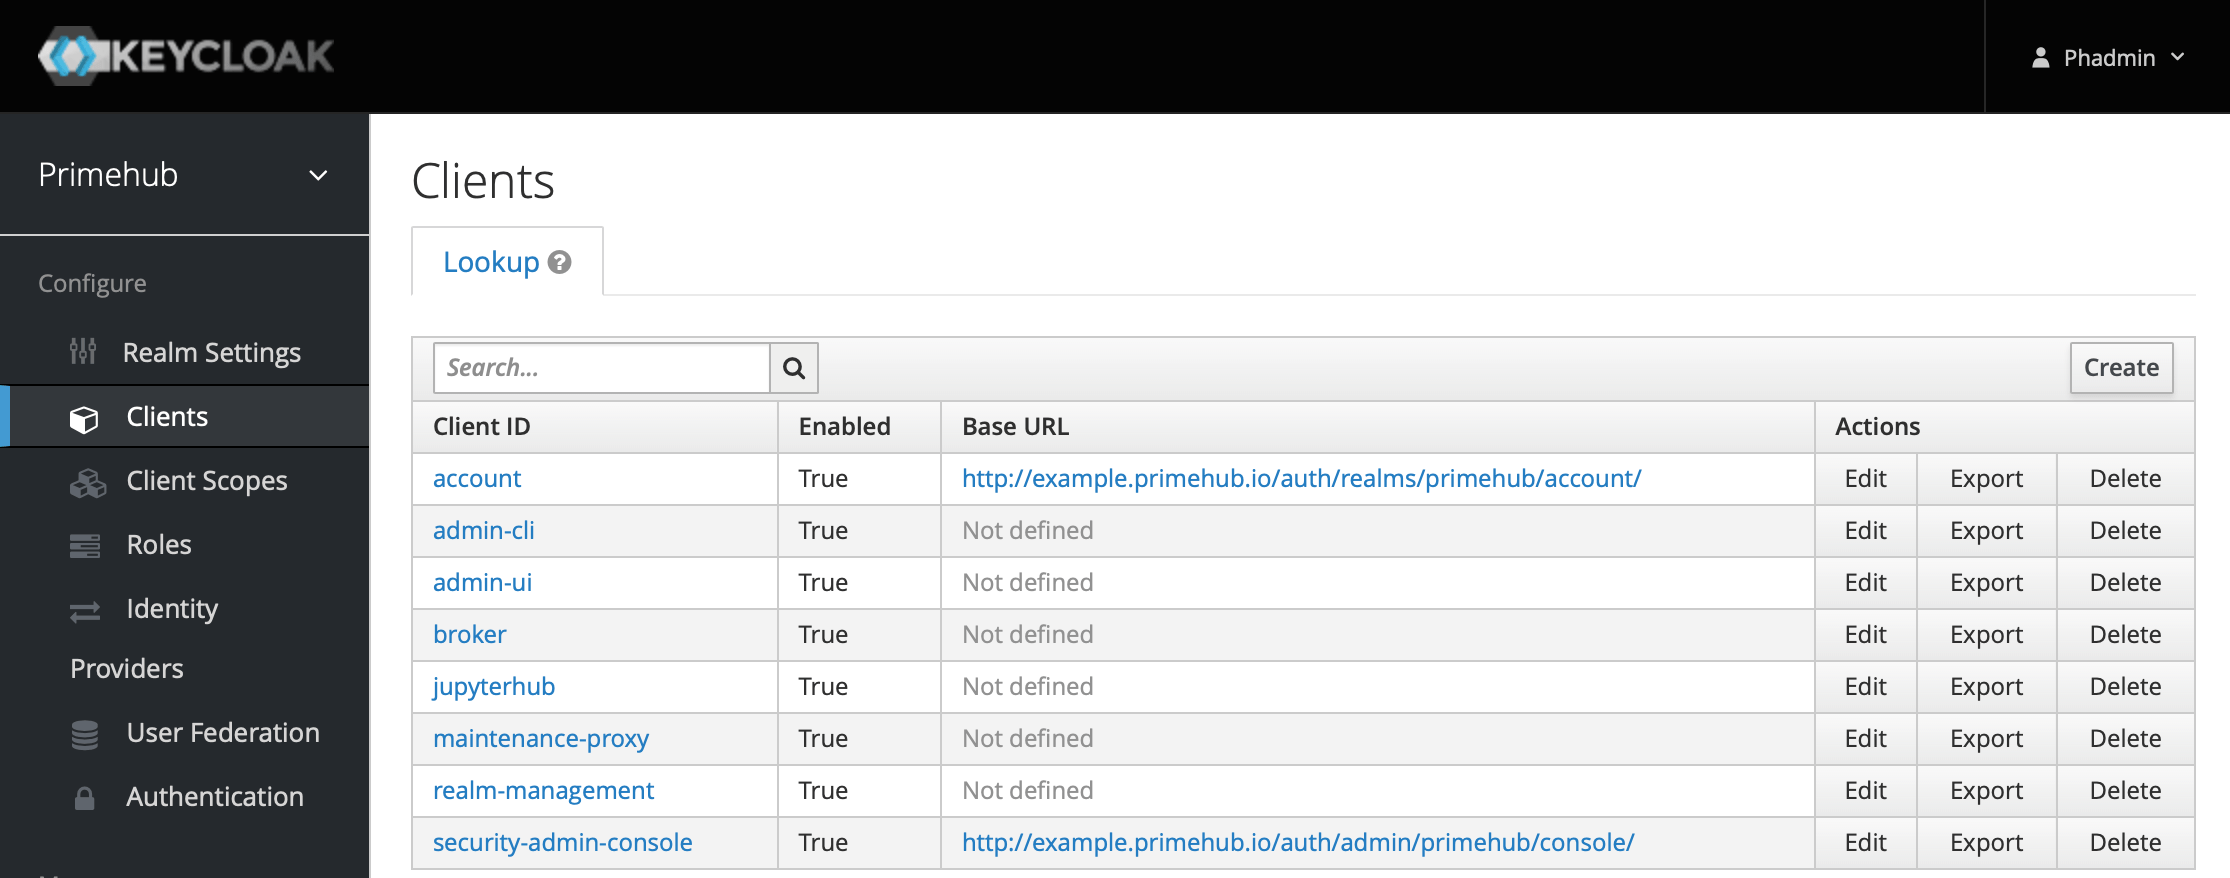
- Fill in Client ID,
grafana-proxy, we will use it later.
Modify client settings
- Access Type:
confidential - Valid Redirect URIs:
http://example.primehub.io/grafana/* - Web Origins:
http://example.primehub.io
- Access Type:
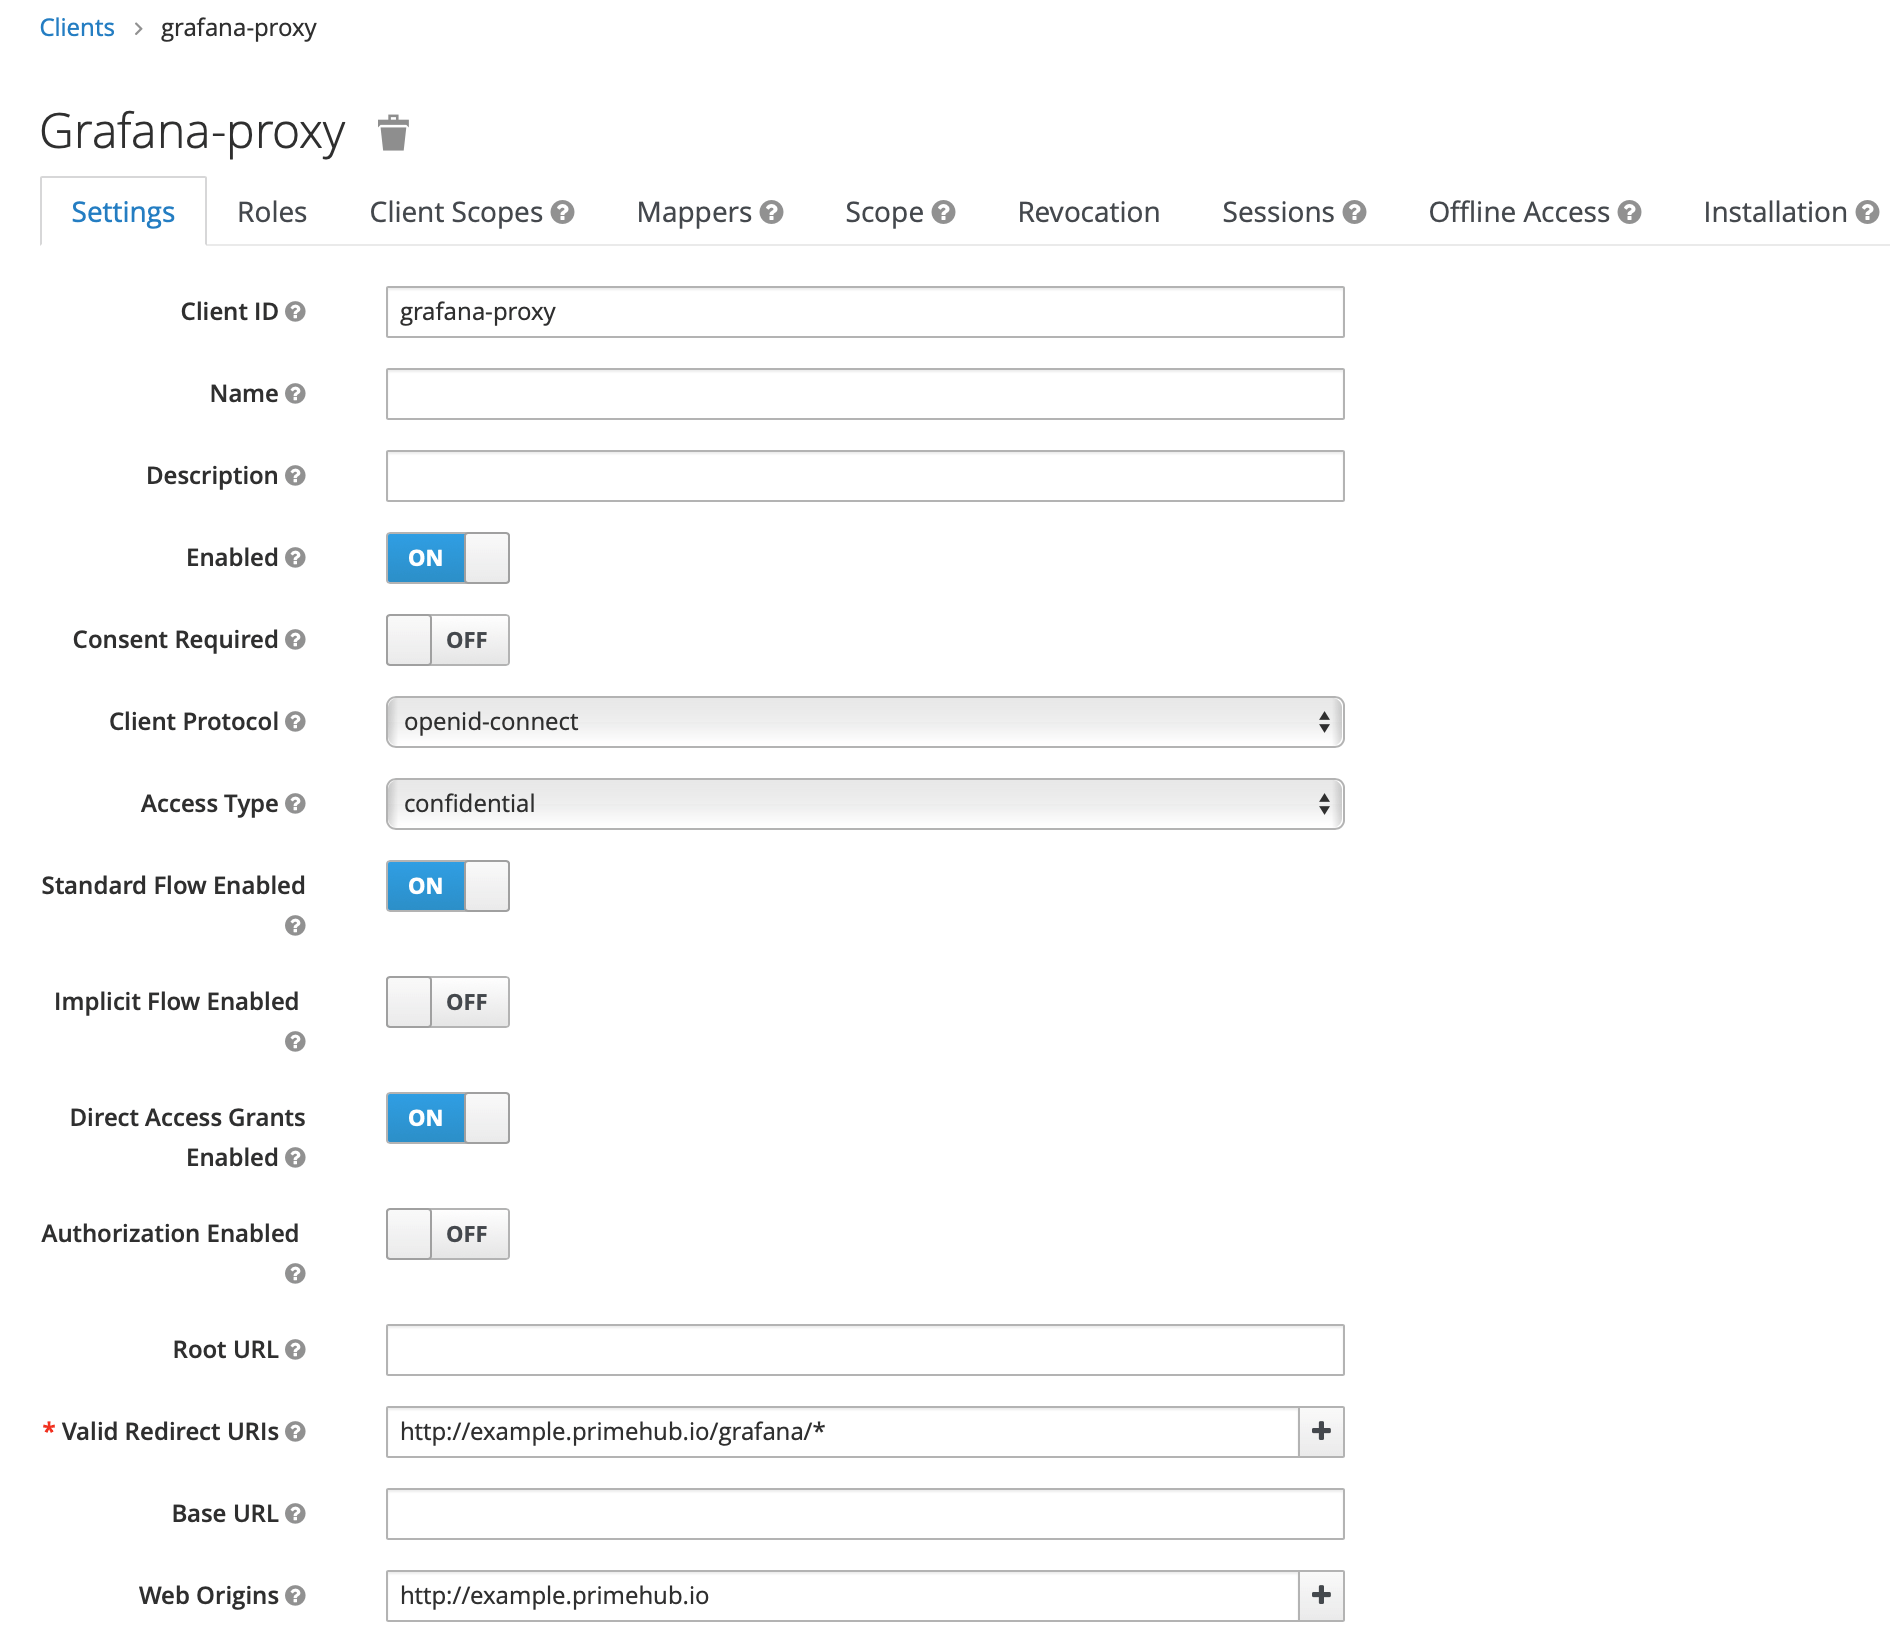
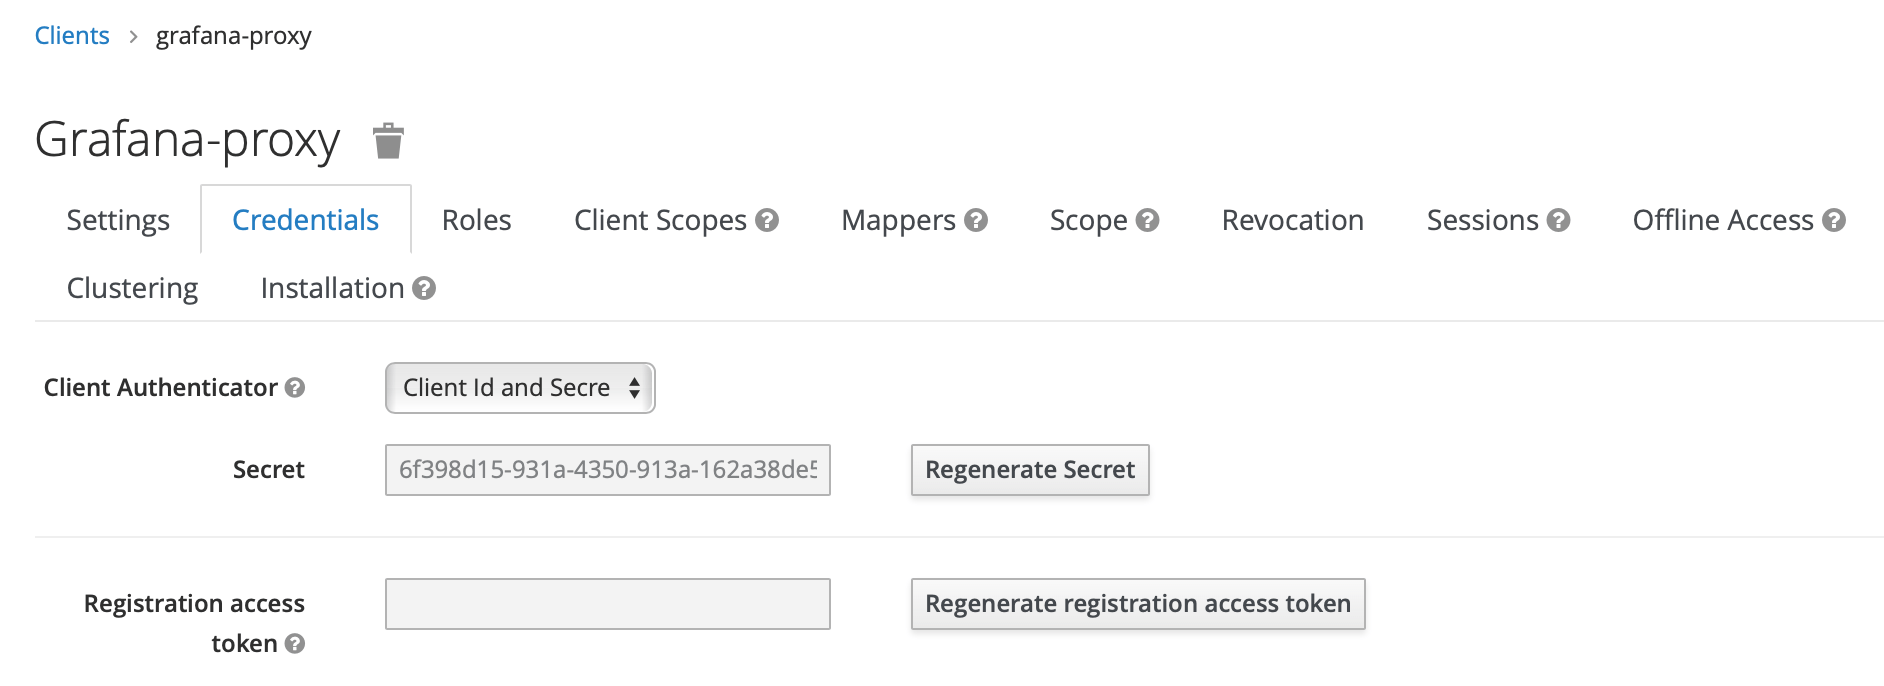
- When Access Type is changed to confidential, a new
Credentialstab displays, open it and copy theSecretvalue, we will use it later (GF_AUTH_GENERIC_OAUTH_CLIENT_SECRETenvironment variable for grafana):
Prepare Prometheus-Operator values file
Here is an example of values file, it requires modifications according to the real circumstance before applying it.
Update the
slack_api_urlwith the slack webhook, or removealertmanagersegment andadditionalPrometheusRulessegment when the alert is not required.Replace
example.primehub.iowith your domainSet
GF_AUTH_GENERIC_OAUTH_CLIENT_SECRETwith the generated client secret by KeyCloak consoleIf NFS client provisioner is not installed, replace
nfs-clientwith provisioned storage classes, which are listed bykubectl get storageclasses.Save the configuration to
prometheus-operator-values.yaml
kubelet:
  serviceMonitor:
    https: true

coreDns:
  enabled: true
  service:
    selector:
      k8s-app: kube-dns

kube-state-metrics:
  resources:
    limits:
      memory: 100Mi
      cpu: 50m
    requests:
      memory: 10Mi
      cpu: 50m

prometheus-node-exporter:
  resources:
    limits:
      memory: 100Mi
      cpu: 50m
    requests:
      memory: 10Mi
      cpu: 50m

prometheus:
  prometheusSpec:
    resources:
      limits:
        memory: 4Gi
        cpu: 1000m
      requests:
        memory: 250Mi
        cpu: 50m
    storageSpec:
      volumeClaimTemplate:
        spec:
          storageClassName: nfs-client
          accessModes: ["ReadWriteOnce"]
          resources:
            requests:
              storage: 10Gi
    replicas: 1
    retention: 10d
    podAntiAffinity: hard

prometheusOperator:
  resources:
    limits:
      cpu: 50m
      memory: 100Mi
    requests:
      cpu: 50m
      memory: 50Mi

alertmanager:
  alertmanagerSpec:
    resources:
      limits:
        memory: 1000Mi
        cpu: 500m
      requests:
        memory: 250Mi
        cpu: 100m
    storage:
      volumeClaimTemplate:
        spec:
          storageClassName: nfs-client
          accessModes: ["ReadWriteOnce"]
          resources:
            requests:
              storage: 10Gi
    replicas: 1
    podAntiAffinity: hard
  config:
    global:
      slack_api_url: 'https://hooks.slack.com/services/T00000000/B00000000/XXXXXXXXXXXXXXXXXXXXXXXX'
    templates:
    - '/etc/alertmanager/template/*.tmpl'
    route:
      group_by: ['alertname', 'cluster', 'service']
      group_wait: 30s
      group_interval: 5m
      repeat_interval: 1h
      receiver: default-receiver
      routes:
      - match:
          alertname: DeadMansSwitch
        receiver: 'null'
      # https://github.com/kubernetes-monitoring/kubernetes-mixin/issues/108
      - match:
          alertname: CPUThrottlingHigh
        receiver: 'null'
    inhibit_rules:
    - source_match:
        severity: 'critical'
      target_match:
        severity: 'warning'
      # Apply inhibition if the alertname is the same.
      equal: ['alertname', 'cluster', 'service']
    receivers:
    - name: default-receiver
      slack_configs:
      - channel: monitor
        color: '{{ if eq .Status "firing" }}danger{{ else }}good{{ end }}'
        fallback: '{{ template "slack.default.fallback" . }}'
        icon_emoji: '{{ template "slack.default.iconemoji" . }}'
        icon_url: '{{ template "slack.default.iconurl" . }}'
        pretext: '{{ .CommonAnnotations.summary }}'
        send_resolved: true
        text: |-
          {{ range .Alerts }}
            {{- if .Annotations.summary }}*Alert:* {{ .Annotations.summary }} - `{{ .Labels.severity }}`{{- end }}
            *Description:* {{ .Annotations.description }}{{ .Annotations.message }}
            *Graph:* <{{ .GeneratorURL }}|:chart_with_upwards_trend:>{{ if or .Annotations.runbook .Annotations.runbook_url }} *Runbook:* <{{ .Annotations.runbook }}{{ .Annotations.runbook_url }}|:spiral_note_pad:>{{ end }}
            *Details:*
            {{ range .Labels.SortedPairs }} * {{ .Name }}:* `{{ .Value }}`
            {{ end }}
          {{ end }}
        title: '[{{ .Status | toUpper }}{{ if eq .Status "firing" }}:{{ .Alerts.Firing | len }}{{ end }}] Prometheus Event Notification'
        title_link: '{{ template "slack.default.titlelink" . }}'
        username: 'Alert Manager'
    - name: "null"

additionalPrometheusRules:
- name: primehub
  groups:
  - name: primehub.rules
    rules:
    - alert: JupyterPodPendingOrUnknown
      expr: sum by (namespace, pod, phase) (kube_pod_status_phase{pod=~"^jupyter-.*", namespace="hub", phase=~"Pending|Unknown"}) > 0
      for: 30s
      labels:
        severity: critical
    - alert: JupyterPageSlow
      expr: (rate(request_duration_seconds_sum{code="302",handler="jupyterhub.handlers.pages.RootHandler"}[1m]) / rate(request_duration_seconds_count{code="302",handler="jupyterhub.handlers.pages.RootHandler"}[1m])) > 3
      for: 10s
      labels:
        severity: warning
      annotations:
        message: JupyterHub root page average response time is slow (> 3 seconds in 10s)
    - alert: JupyterPageSlow
      expr: (rate(request_duration_seconds_sum{code="302",handler="jupyterhub.handlers.pages.RootHandler"}[1m]) / rate(request_duration_seconds_count{code="302",handler="jupyterhub.handlers.pages.RootHandler"}[1m])) > 0.1
      for: 1h
      labels:
        severity: warning
      annotations:
        message: JupyterHub root page average response time is slow (> 0.1 seconds in 1h)
    - alert: JupyterPageSlow
      expr: (rate(request_duration_seconds_sum{code="200",handler="jupyterhub.handlers.pages.SpawnHandler"}[1m]) / rate(request_duration_seconds_count{code="200",handler="jupyterhub.handlers.pages.SpawnHandler"}[1m])) > 3
      for: 10s
      labels:
        severity: warning
      annotations:
        message: JupyterHub spawn page average response time is slow (> 3 seconds in 10s)
    - alert: JupyterPageSlow
      expr: (rate(request_duration_seconds_sum{code="200",handler="jupyterhub.handlers.pages.SpawnHandler"}[1m]) / rate(request_duration_seconds_count{code="200",handler="jupyterhub.handlers.pages.SpawnHandler"}[1m])) > 0.1
      for: 1h
      labels:
        severity: warning
      annotations:
        message: JupyterHub spawn page average response time is slow (> 0.1 seconds in 1h)

grafana:
  adminPassword: your-grafana-password
  adminUser: admin
  enabled: true
  env:
    GF_AUTH_GENERIC_OAUTH_API_URL: http://keycloak-http.hub/auth/realms/primehub/protocol/openid-connect/userinfo
    GF_AUTH_GENERIC_OAUTH_AUTH_URL: http://example.primehub.io/auth/realms/primehub/protocol/openid-connect/auth
    GF_AUTH_GENERIC_OAUTH_CLIENT_ID: grafana-proxy
    GF_AUTH_GENERIC_OAUTH_CLIENT_SECRET: xxxxxxxx-xxxx-xxxx-xxxx-xxxxxxxxxxxx
    GF_AUTH_GENERIC_OAUTH_ENABLED: "true"
    GF_AUTH_GENERIC_OAUTH_TOKEN_URL: http://keycloak-http.hub/auth/realms/primehub/protocol/openid-connect/token
    GF_SERVER_ROOT_URL: http://example.primehub.io/grafana
  grafana.ini:
    auth:
      signout_redirect_url: http://example.primehub.io/console/oidc/logout
    server:
      domain: example.primehub.io
      root_url: http://example.primehub.io/grafana
      serve_from_sub_path: "true"
  image:
    tag: 6.3.0
  ingress:
    annotations:
      kubernetes.io/ingress.class: nginx
      kubernetes.io/tls-acme: "true"
    enabled: true
    hosts:
    - example.primehub.io
    path: /grafana
  persistence:
    accessModes:
    - ReadWriteOnce
    enabled: true
    size: 10Gi
    storageClassName: nfs-client
  resources:
    limits:
      cpu: 500m
      memory: 1000Mi
    requests:
      cpu: 100m
      memory: 250Mi
Install Prometheus-Operator
Add prometheus-community Helm repo
helm repo add prometheus-community https://prometheus-community.github.io/helm-chartsInstall by Helm
helm upgrade prometheus-operator prometheus-community/kube-prometheus-stack \
  -n monitoring --create-namespace --install -f prometheus-operator-values.yaml
Install PrimeHub Dashboard on Grafana
Add infuseai Helm repo
helm repo add infuseai https://charts.infuseai.io
helm repo update
Install PrimeHub dashboard
helm -n monitoring install primehub-grafana-dashboard-basic \
  infuseai/primehub-grafana-dashboard-basic \
  --set "modelDeployment.enabled=true"
The
modelDeployment.enabled=trueis required if PrimeHub dashboard is for the model deployment feature as well.