Model Deployment (Alpha)
Alpha version. It is subject to changes in the stable release.
Model Deployment feature that users are allowed to manage model deployment endpoints within Group Management with CRUD operations. If the feature is enabled within a group, end-users of the group are allowed to deploy models obeying the restriction of the group quota. While a deployed model serves, administrators are able to monitor the status of model service such service health and resources usage information; moreover, end-users are able to check deployment history and log.
Enable Model Deployment in Group Management
First, we have to turn on Model Deployment in groups.

If the current group's Model Deployment is not enabled, it shows a message
Feature not available - Model Deployment is not enabled for this group. Please contact your administrator to enable it.
Please contact Admin to turn on it or switch to a group which Model Deployment is enabled.
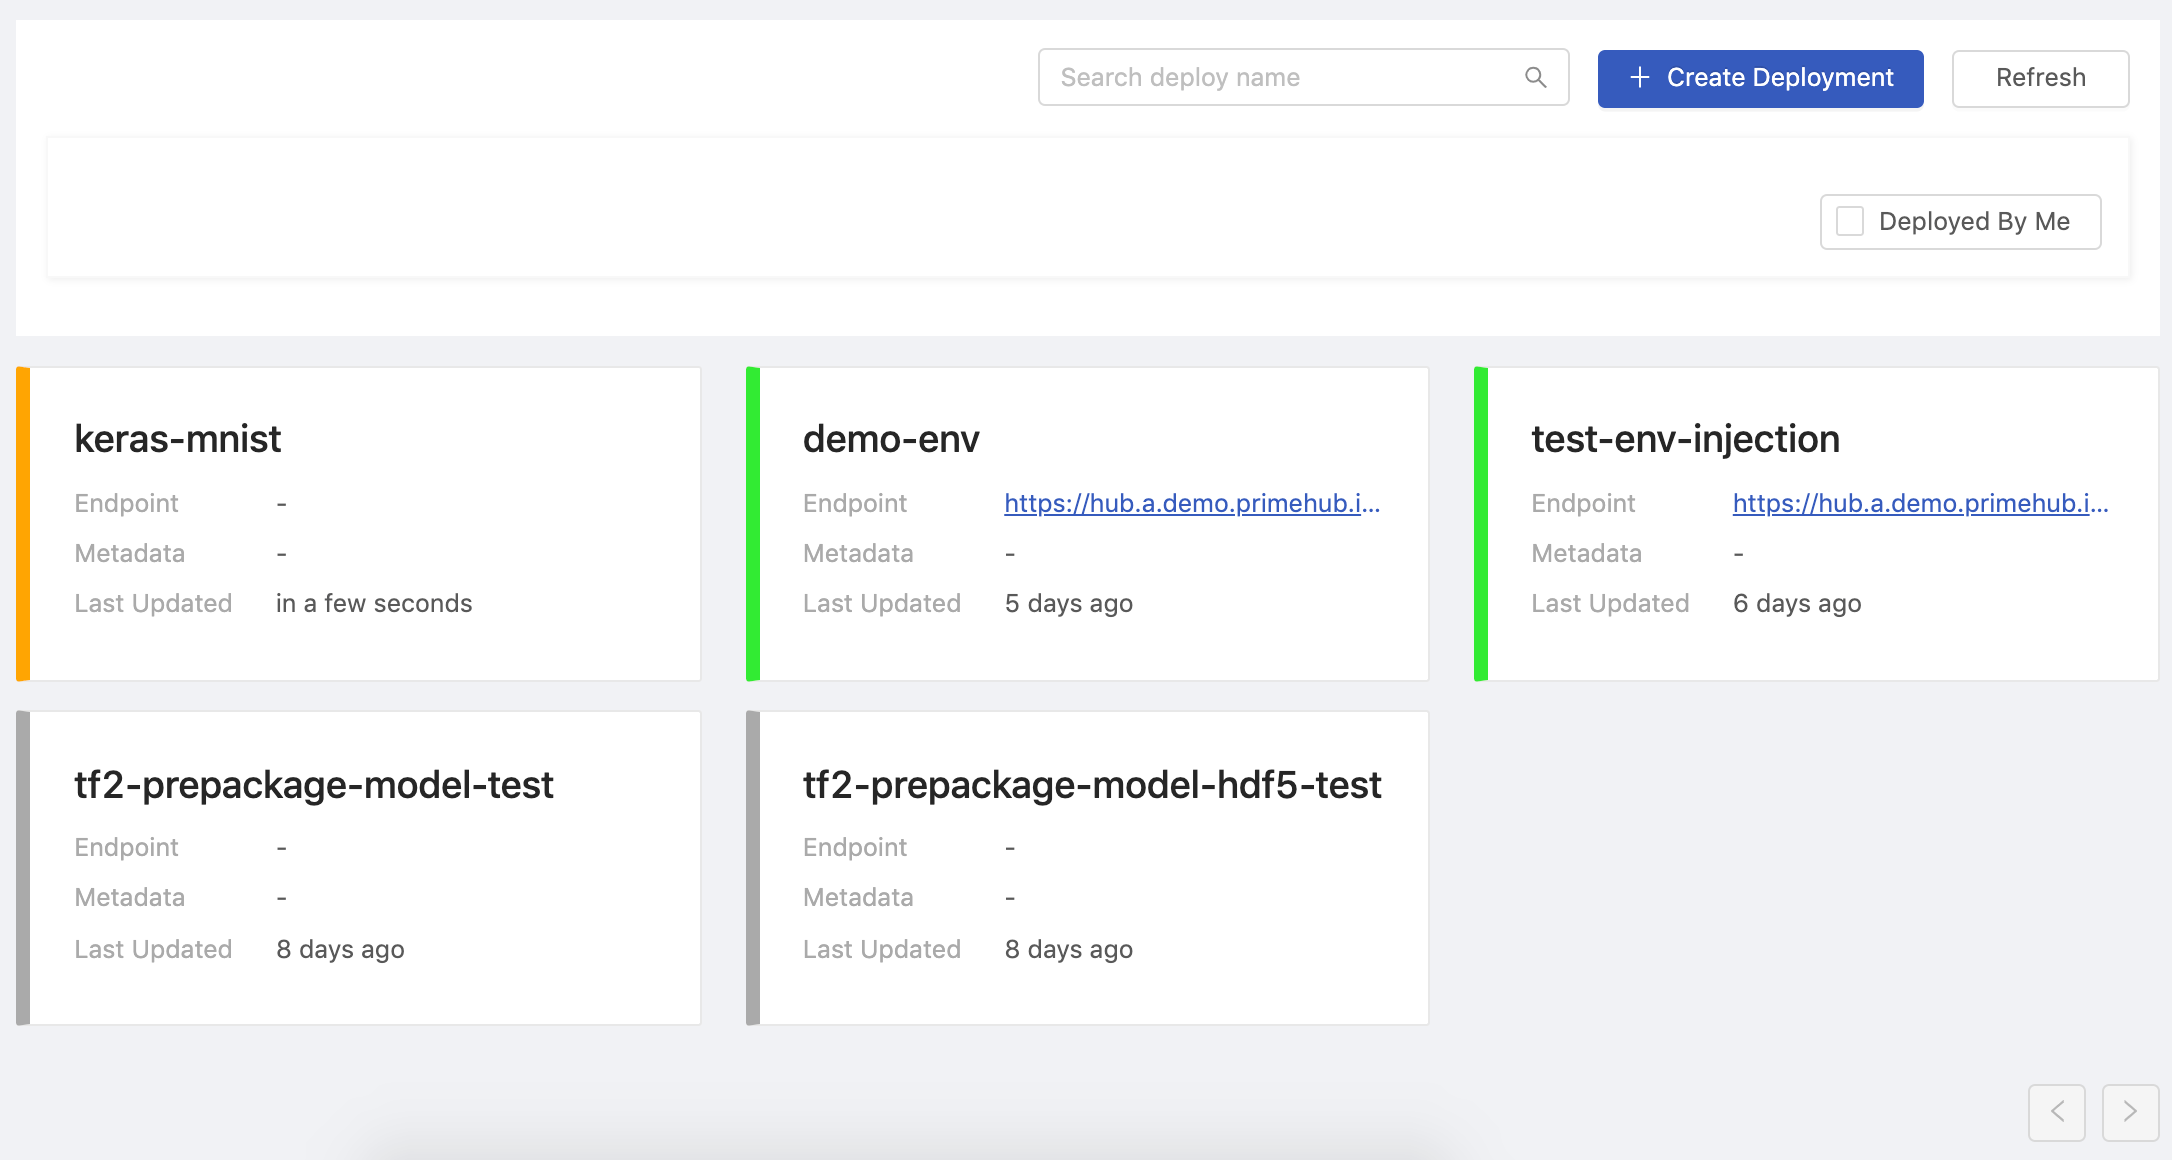
List
This page indicates all of deployed services status.
| Status | Deployed | Failed | Deploying | Stopped |
|---|
Cell
Each cell represents a deployment. Clicking on a cell to view the detail.
Tips
Hovering the cursor over Metadata
Viewof a cell, it lists the metadata view.Hovering the cursor over Endpoint
Linkshows the entire link and clicking the link makes a copy to the clipboard.
| Info | Description |
|---|---|
| Title | Deployment name |
| Group | Deployment's owner group. |
| Endpoint | Where the model is deployed and serve. |
| Metadata | Hovering over View to display the metadata info |
| Last Updated | Last updated time. |
Search deploy name: Search deployments by a keyword.Create Deploymentbutton: Clicking for a deployment creation.Refreshbutton: Clicking to retrieve the latest statuses of deployments.Deployed By Me: Check; list deployments deployed by "me".
Create
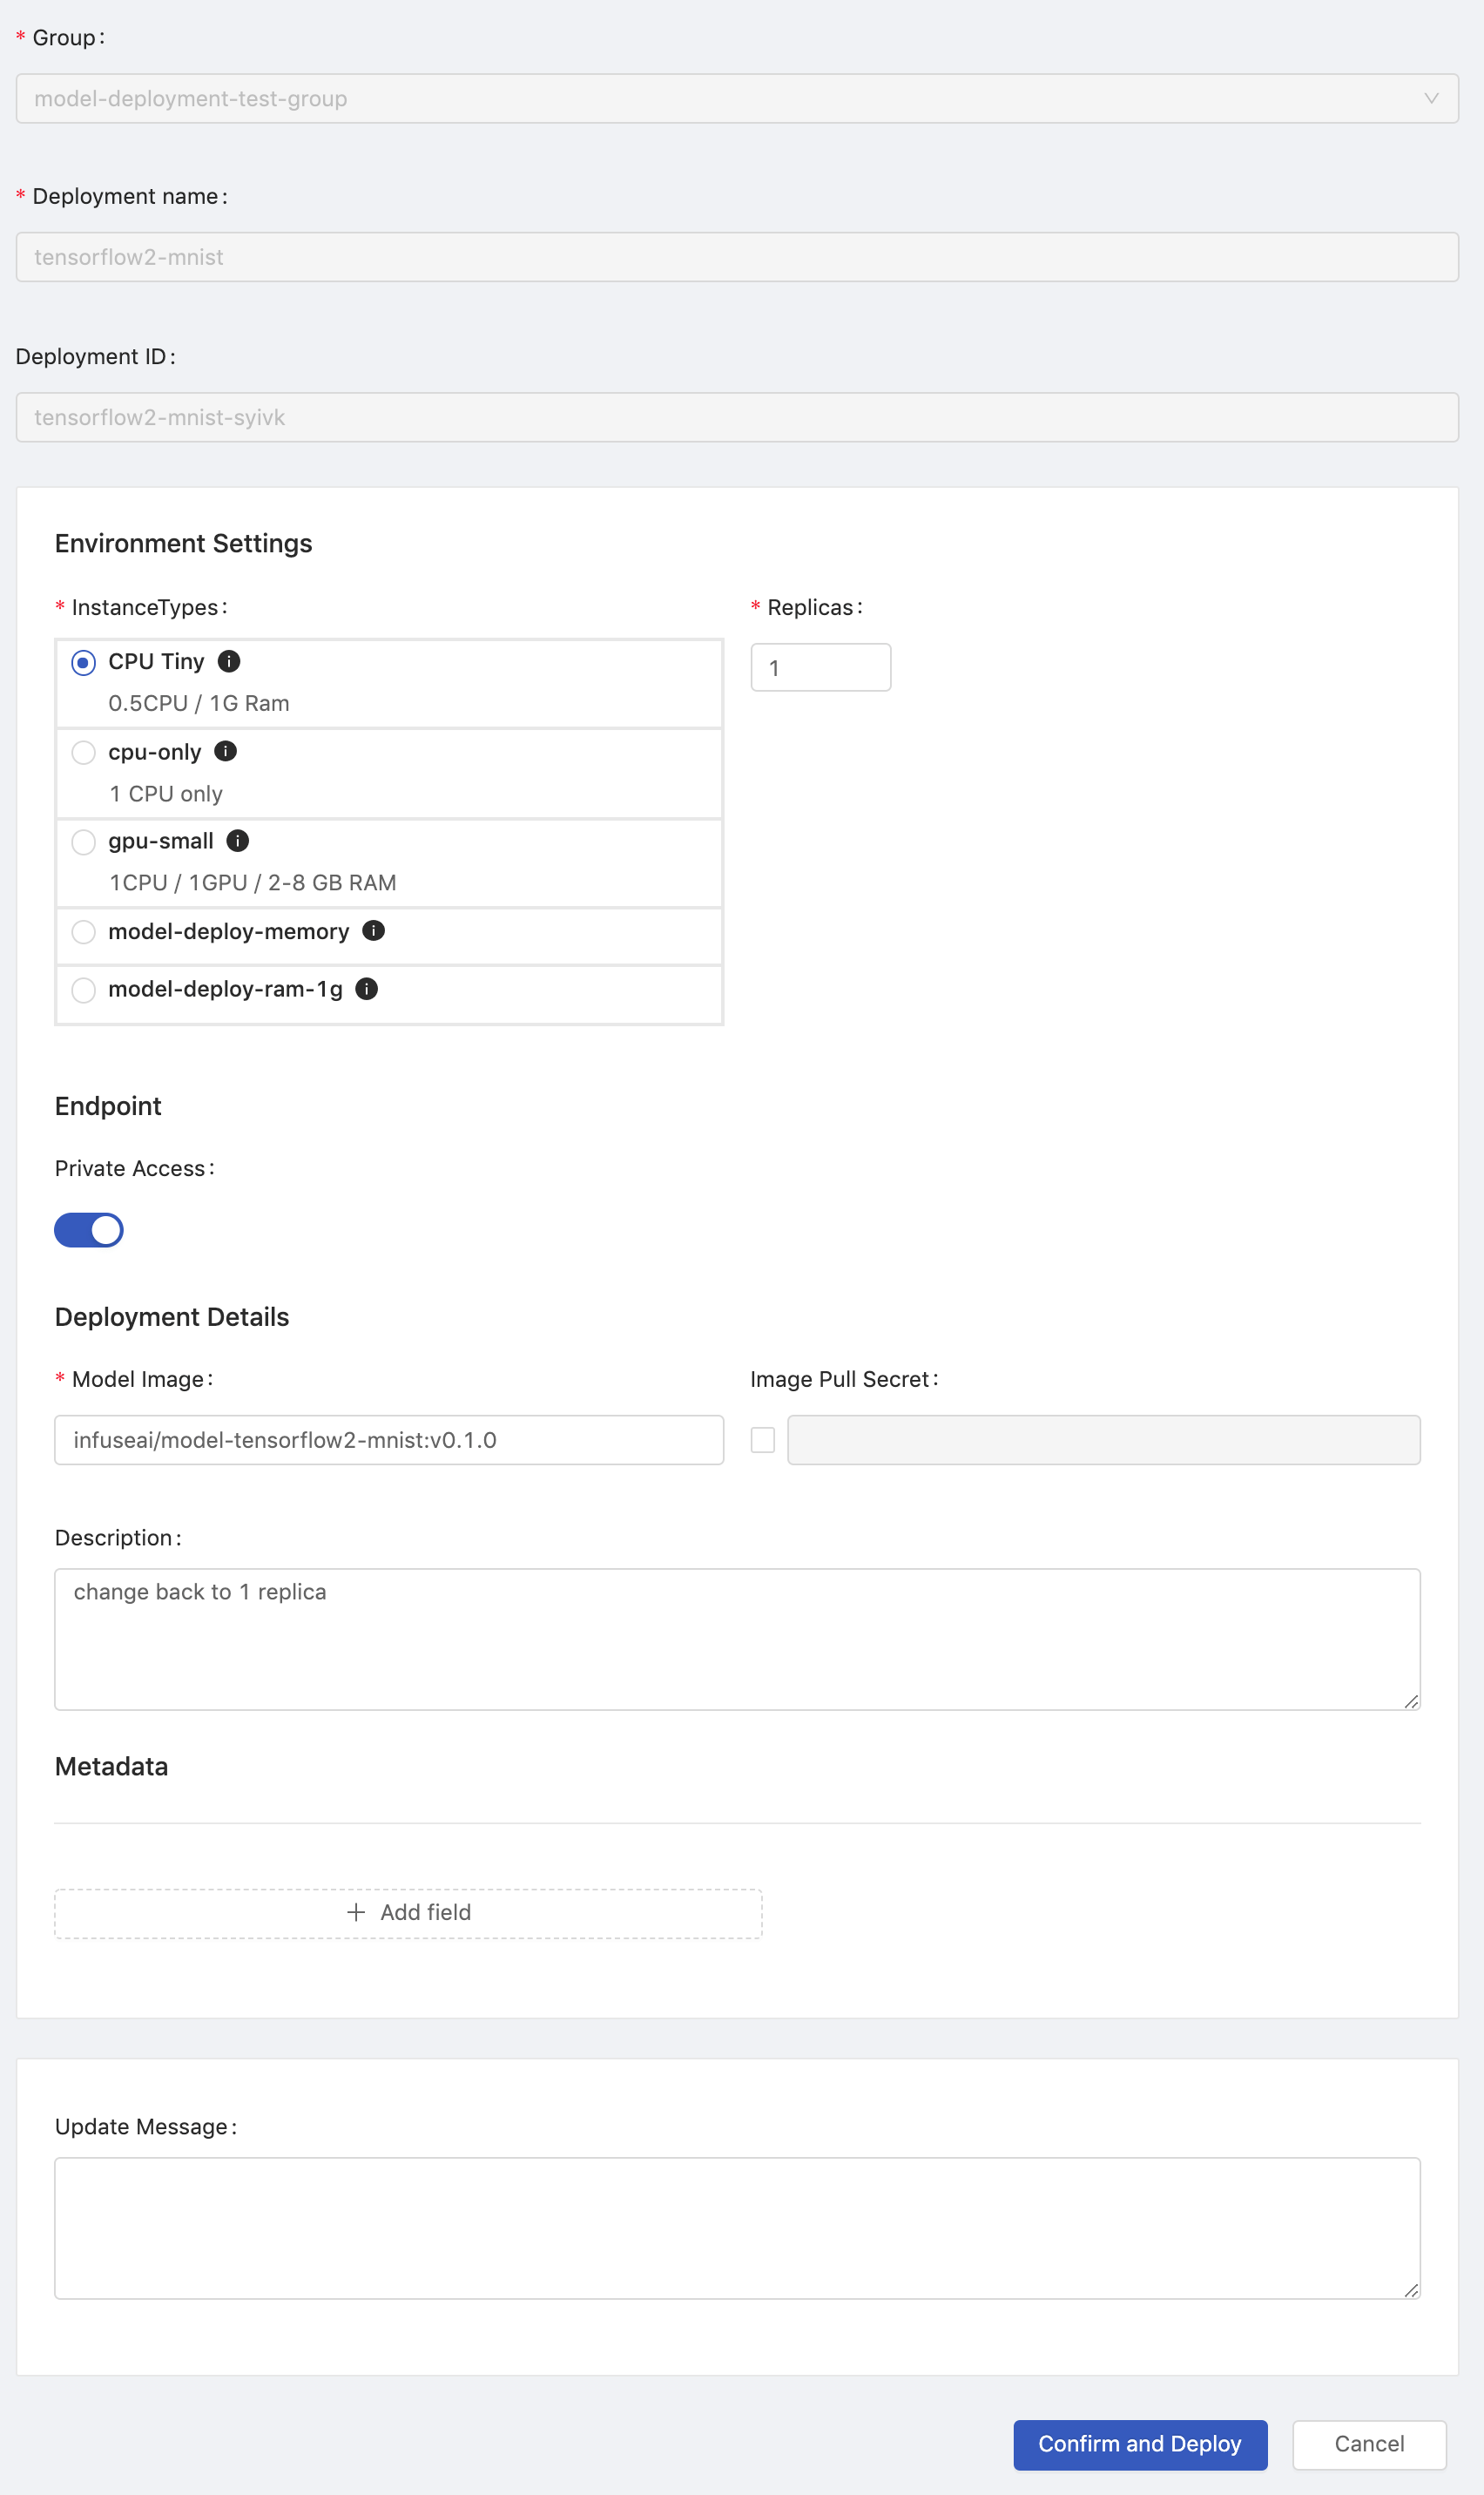
Confirm if the current group is what you desire; switch the group by the Group: dropdown at the top of the right side.
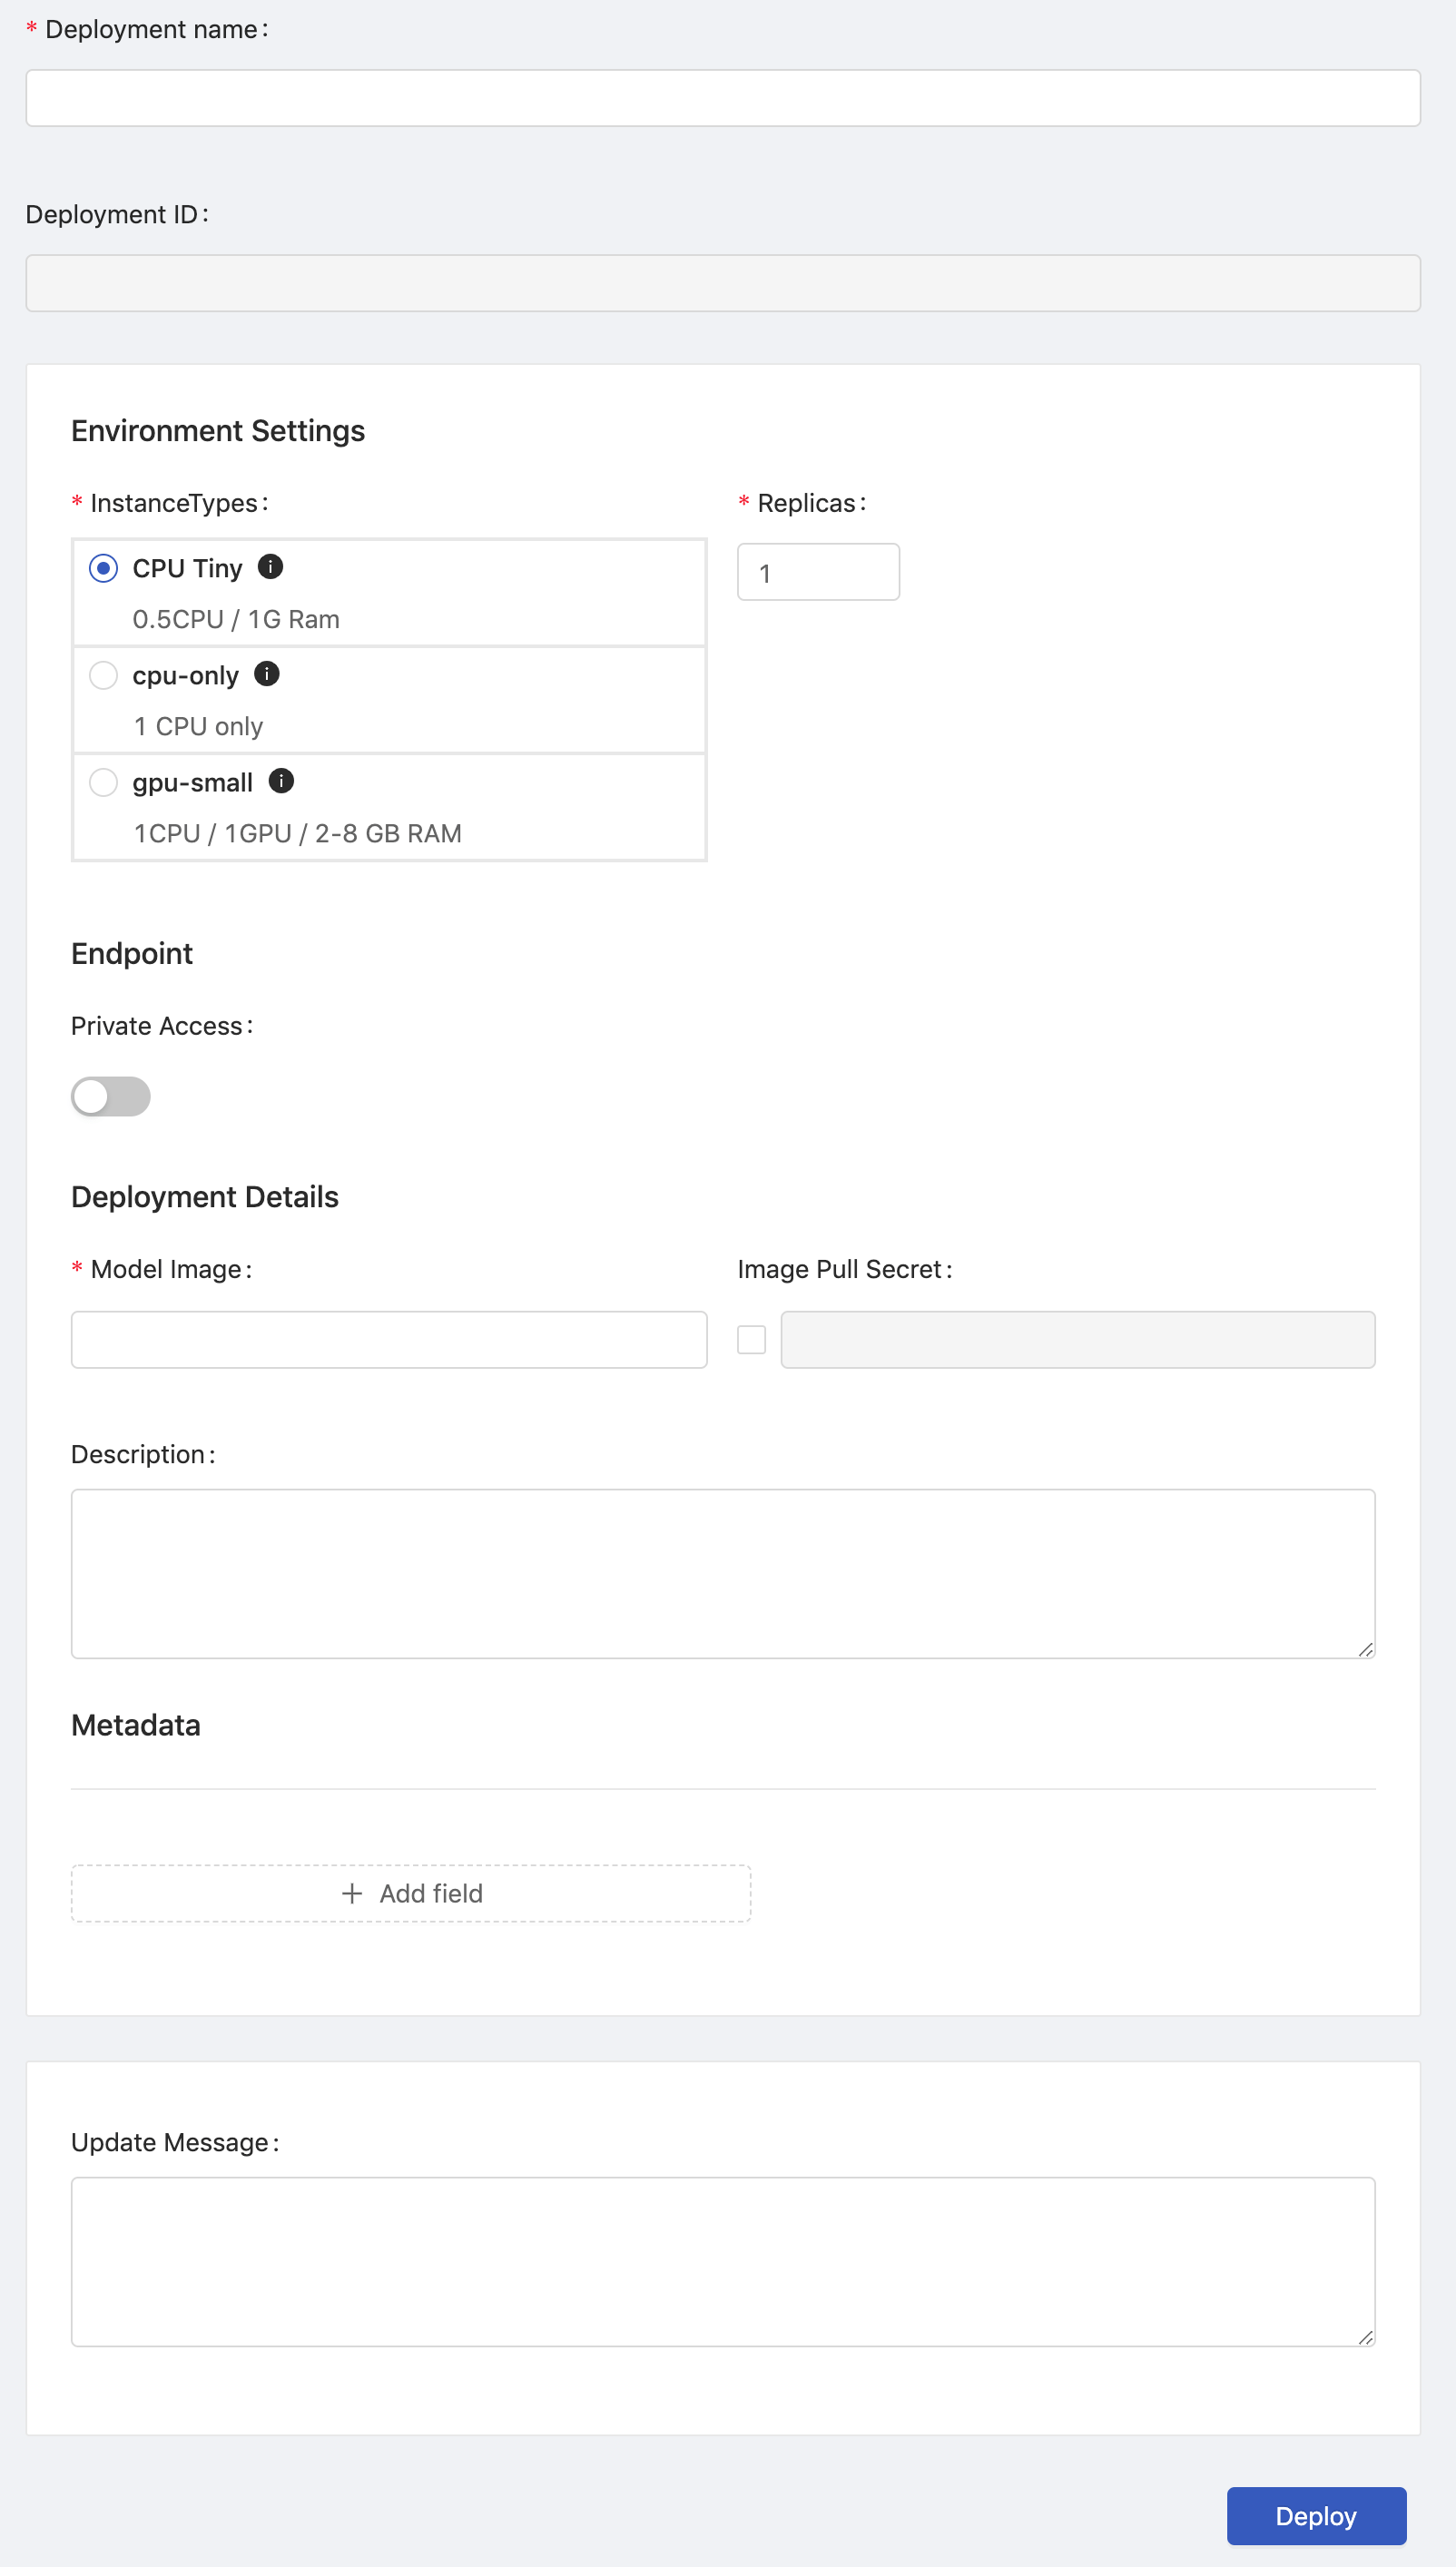
Environment Settings
InstanceTypes: Select a instance type which allocates resources for the job.Replicas: How many replicas for the service.
Endpoint
Private Access: The toggle of private access of the endpoint; if enabled, there isClientstab appearing in detail page.
Deployment Details
Deployment Name: The name of the deployment.Deployment ID: An unique ID.Model Image: The image which the model is based on.Image Pull Secret: a pull secret for the model image if required.Descriptions: User input description.Update Message: Leave a message here for each update.
Metadata
We can add key-value pairs.
Name: The name of key.Value: The value.
Click Deploy button to start the deployment.
One the deployment is triggered, there is a notification popping up, we can click on it to view the deployment detail.
Deployment Detail
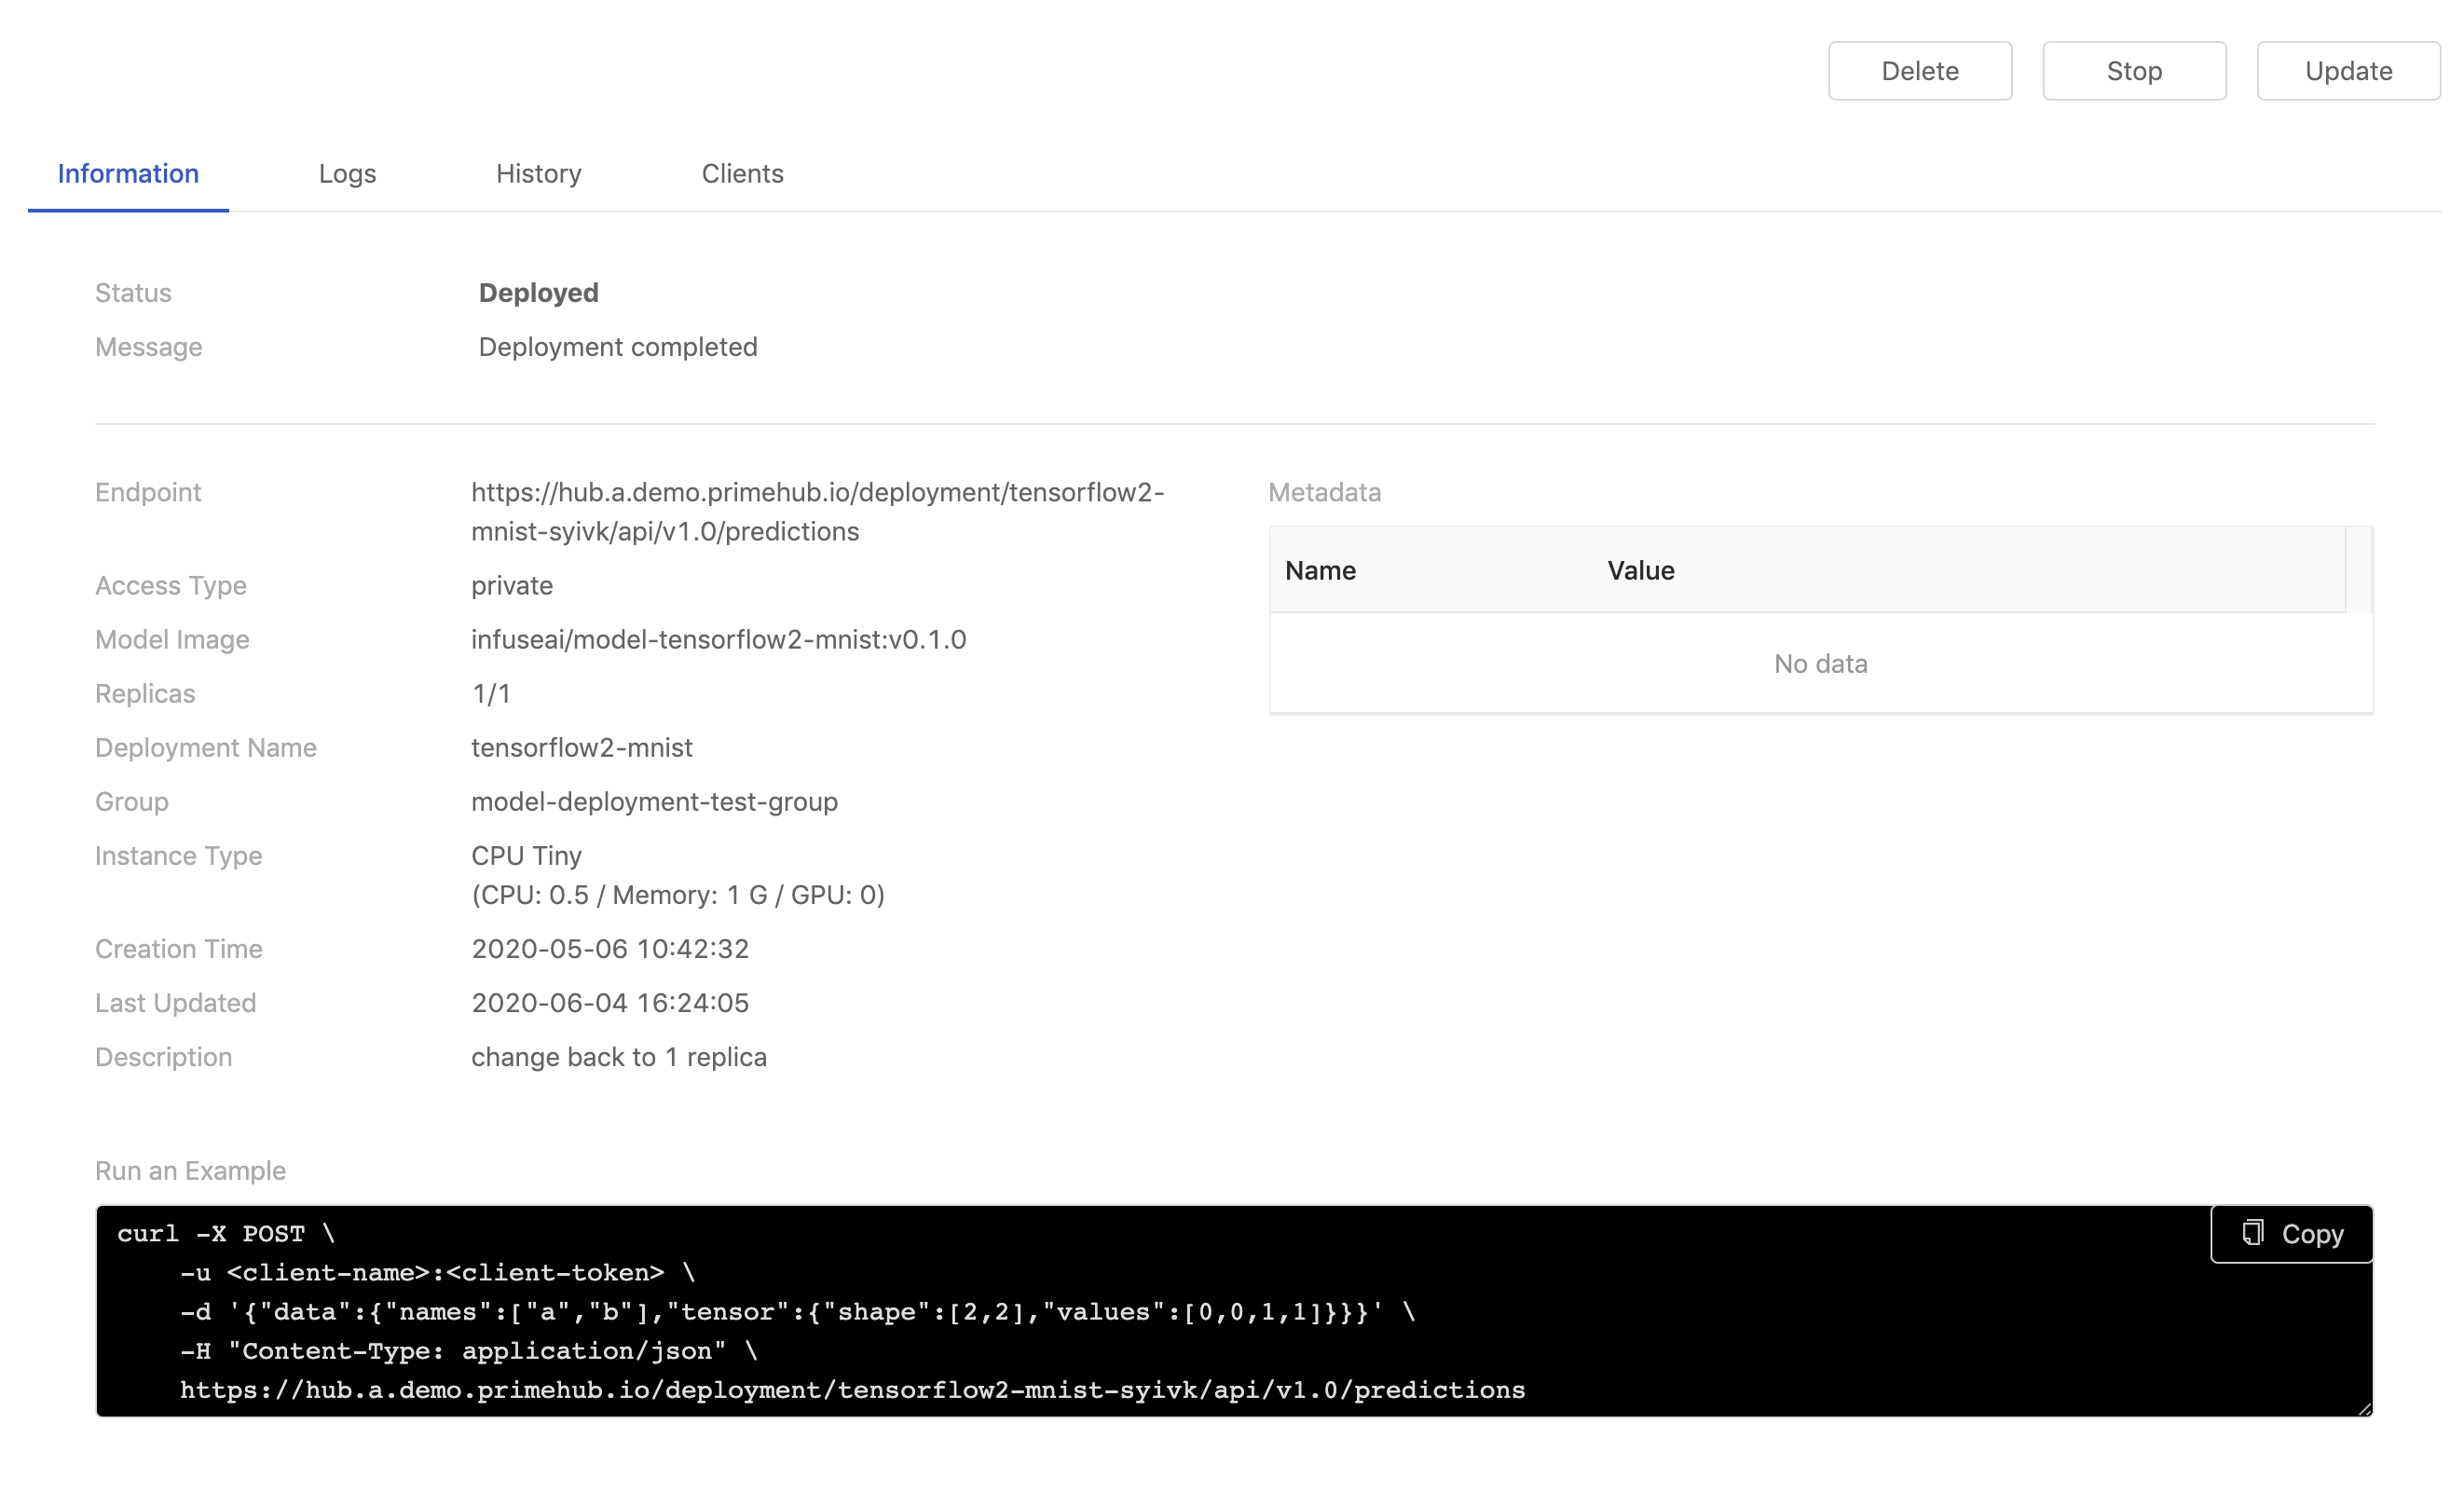
Information
| Info | Description |
|---|---|
| Status | The status of the deployment. |
| Message | The message related to the deployment if any. |
| Endpoint | Where the model is deployed and serve. |
| Access Type | Public or Private |
| Model Image | The image which the model is based on. |
| Replicas | The replicas of the deployment. |
| Deployment Name | The name of the deployment. |
| Group | The owner group. |
| Instance Type | The resources allocation which is requested for the deployment. |
| Creation Time | Timestamps |
| Last Updated | Timestamps |
| Description | The description which users input during the creation. |
| Run an Example | Verifying the service by using curl querying the service; it is varied with Public or Private access. |
Logs
Replicas: Select a replica.
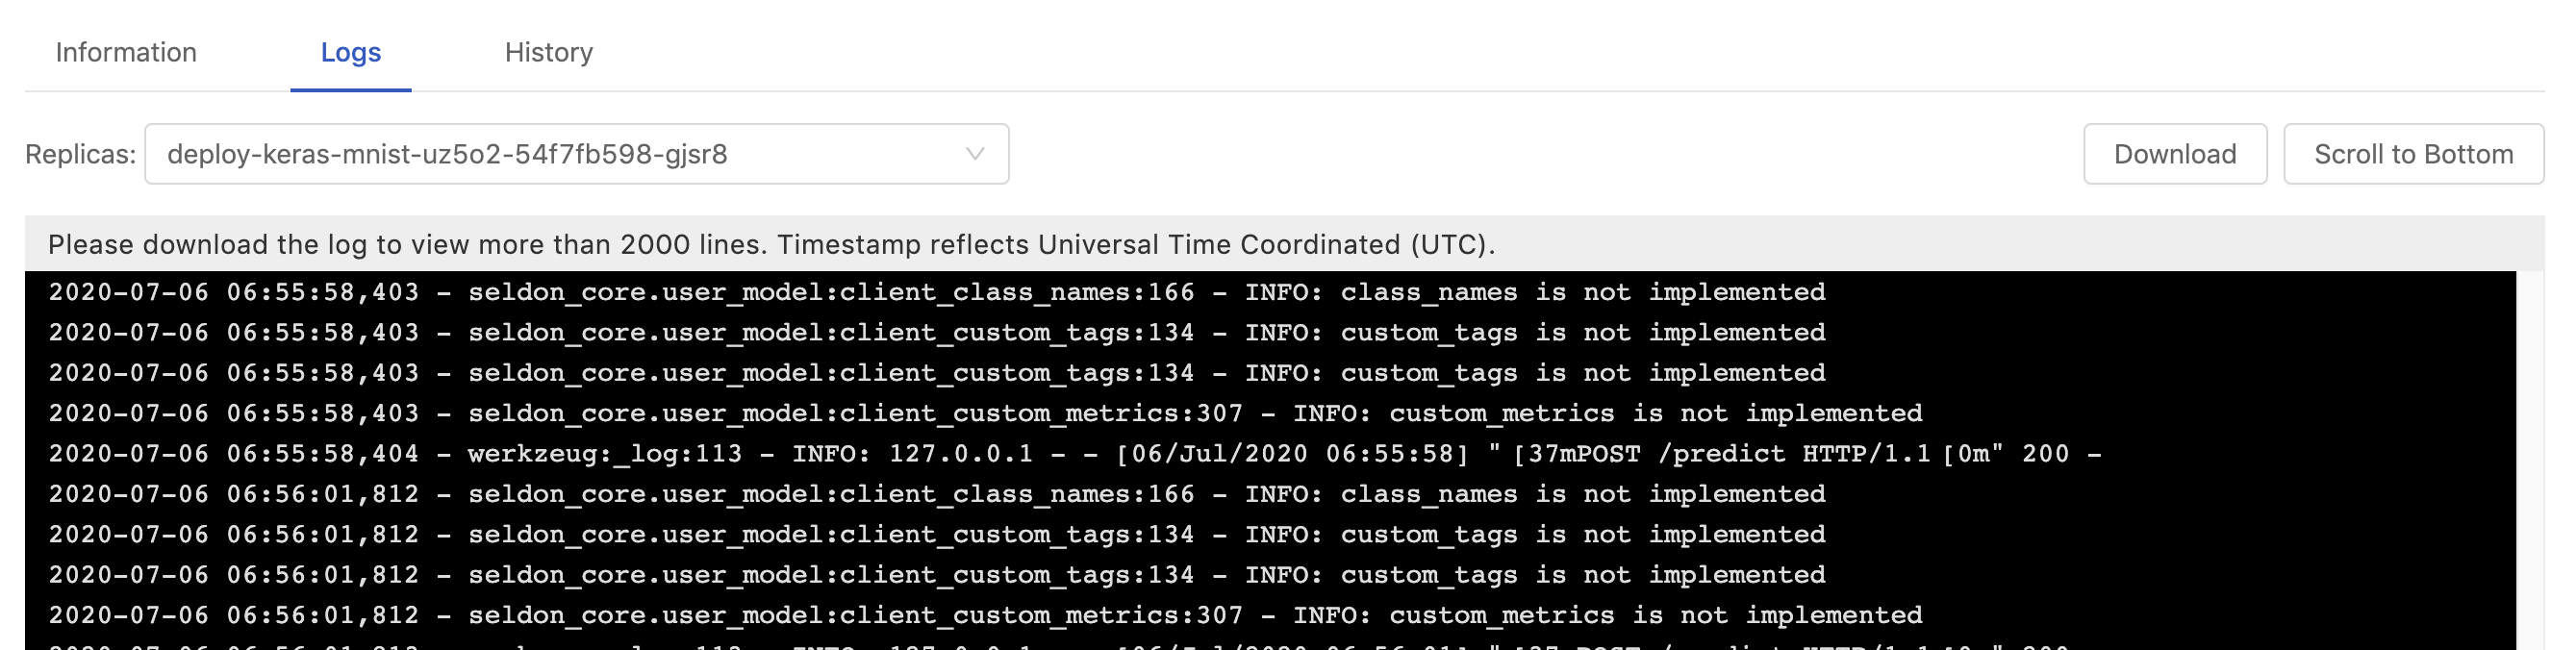
In Logs tab, the logs of current deployment are displayed here.
Timestamp reflects Universal Time Coordinated (UTC).
Clicking Scroll to Bottom button skips to the bottom of logs.
It displays only logs of latest 2000 lines; clicking the
Downloadbutton to download the whole log file.
History
In History tab, we can view the detail of historical deployments with each update message.
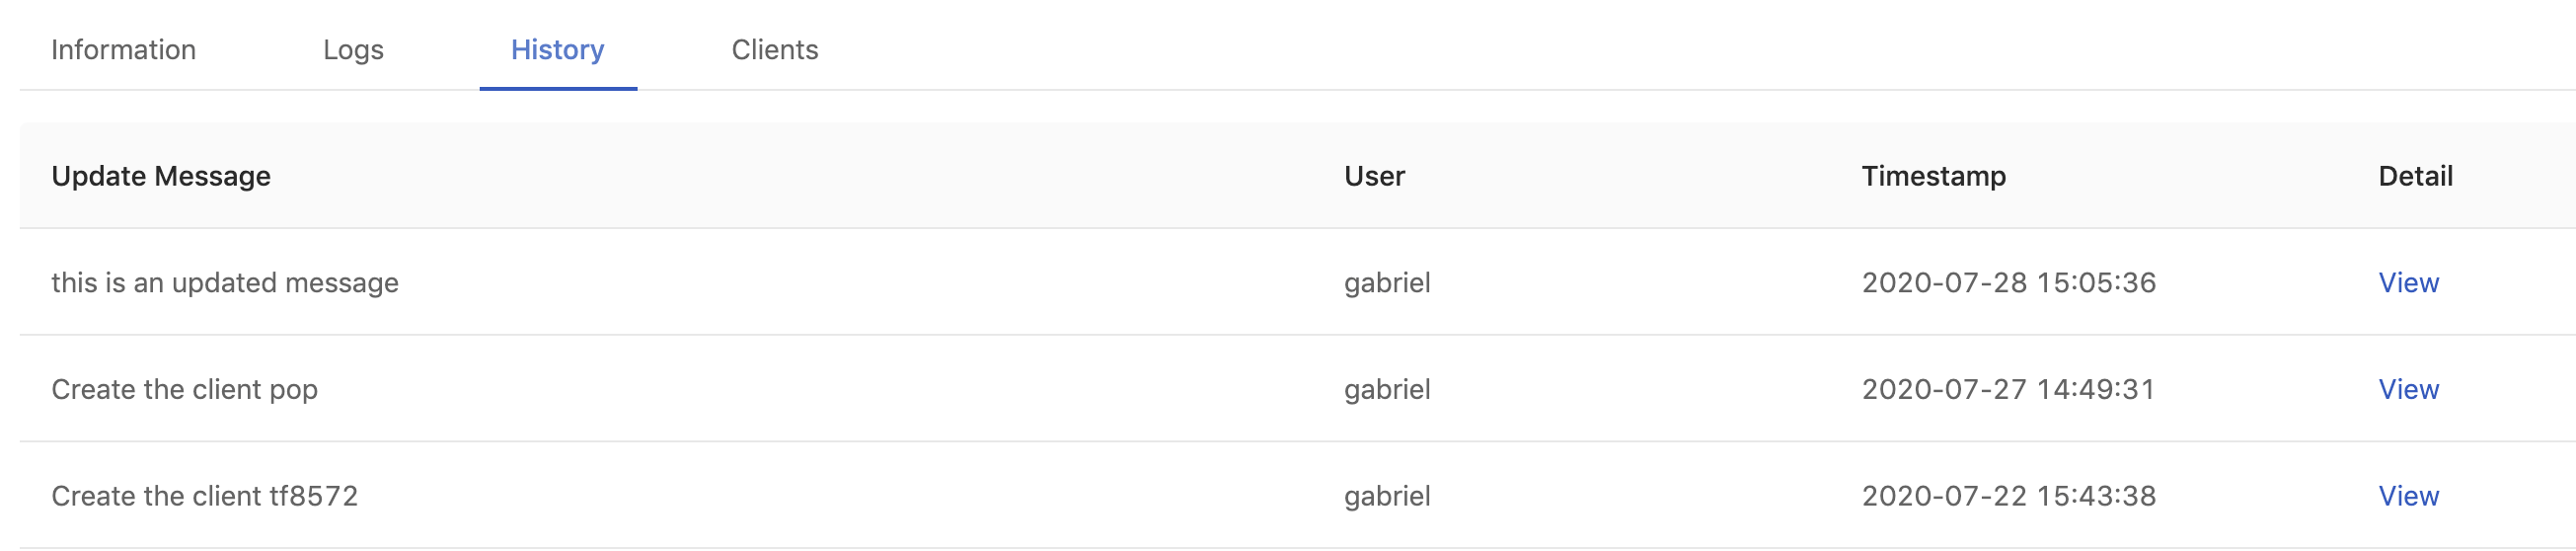
Clicking on the View link for the detail of each deployment.
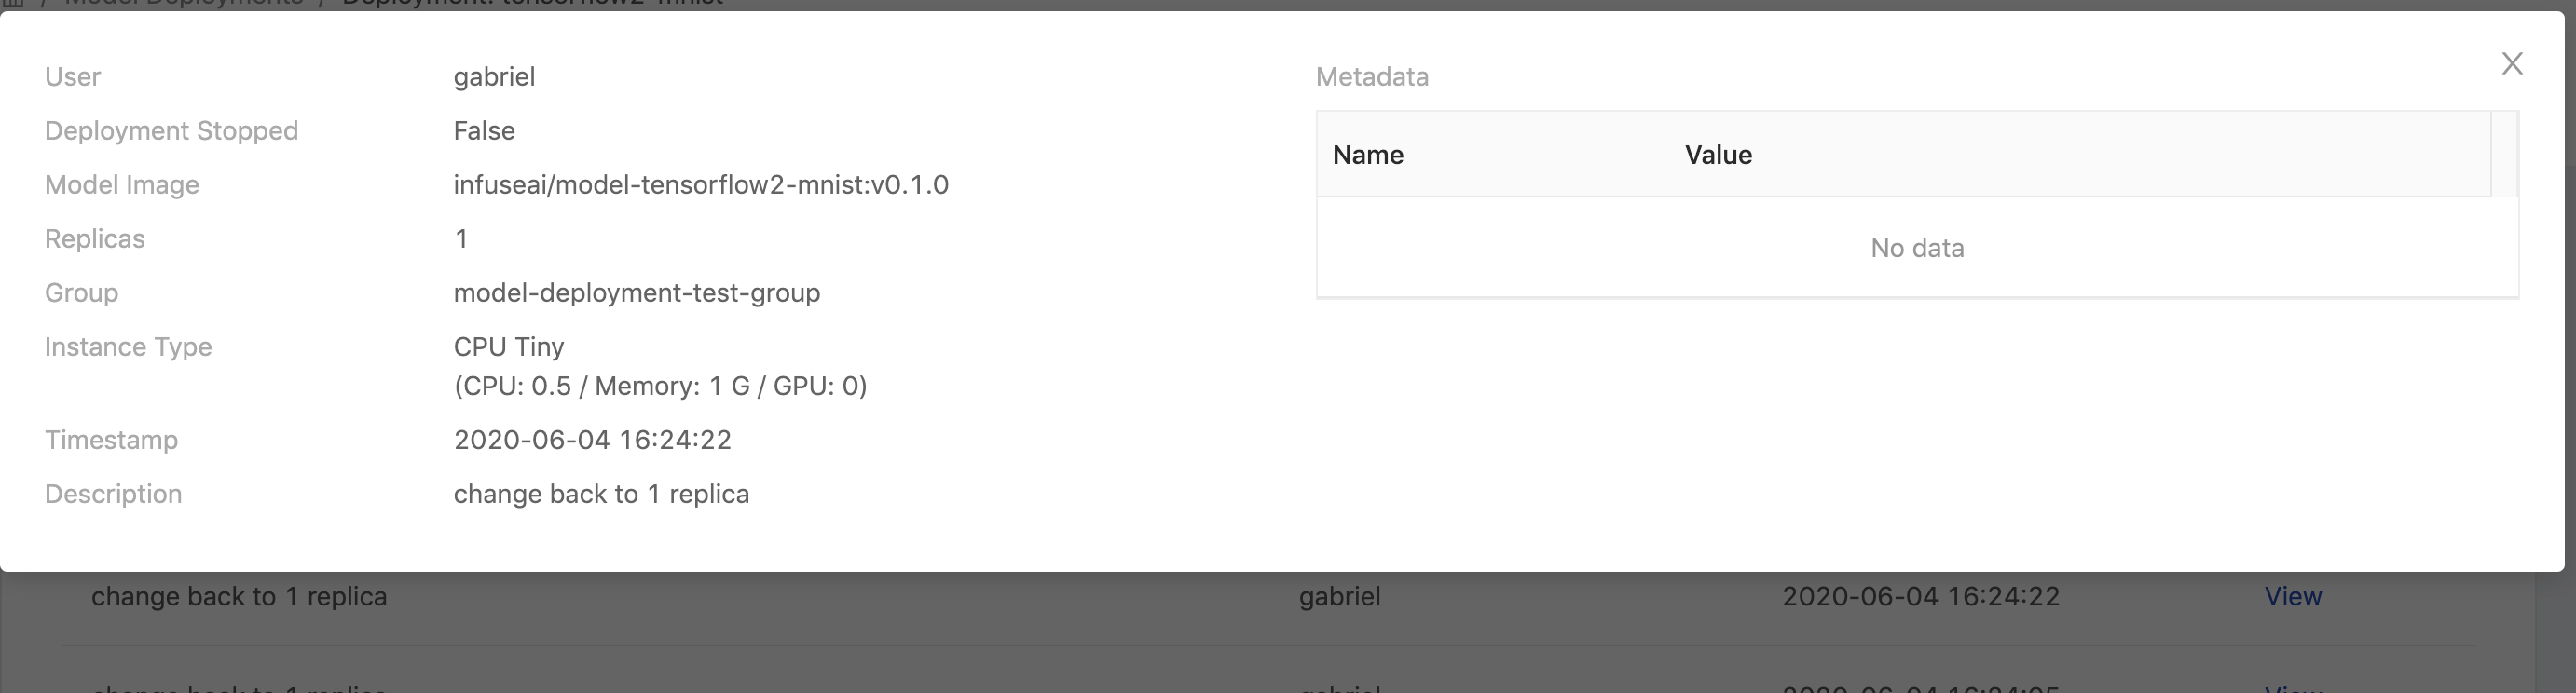
| Info | Description |
|---|---|
| User | Who triggered this deployment |
| Deployment Stopped | true or false |
| Model Image | The model image url |
| Replicas | The amount of replicas |
| Group | The deployment's owner group |
| Instance Type | The instance type is selected |
| Timestamp | Last updated time |
| Description | User input description |
| Metadata | Metadata mappings table |
Clients
This tab appears if Private Access of the endpoint is enabled.
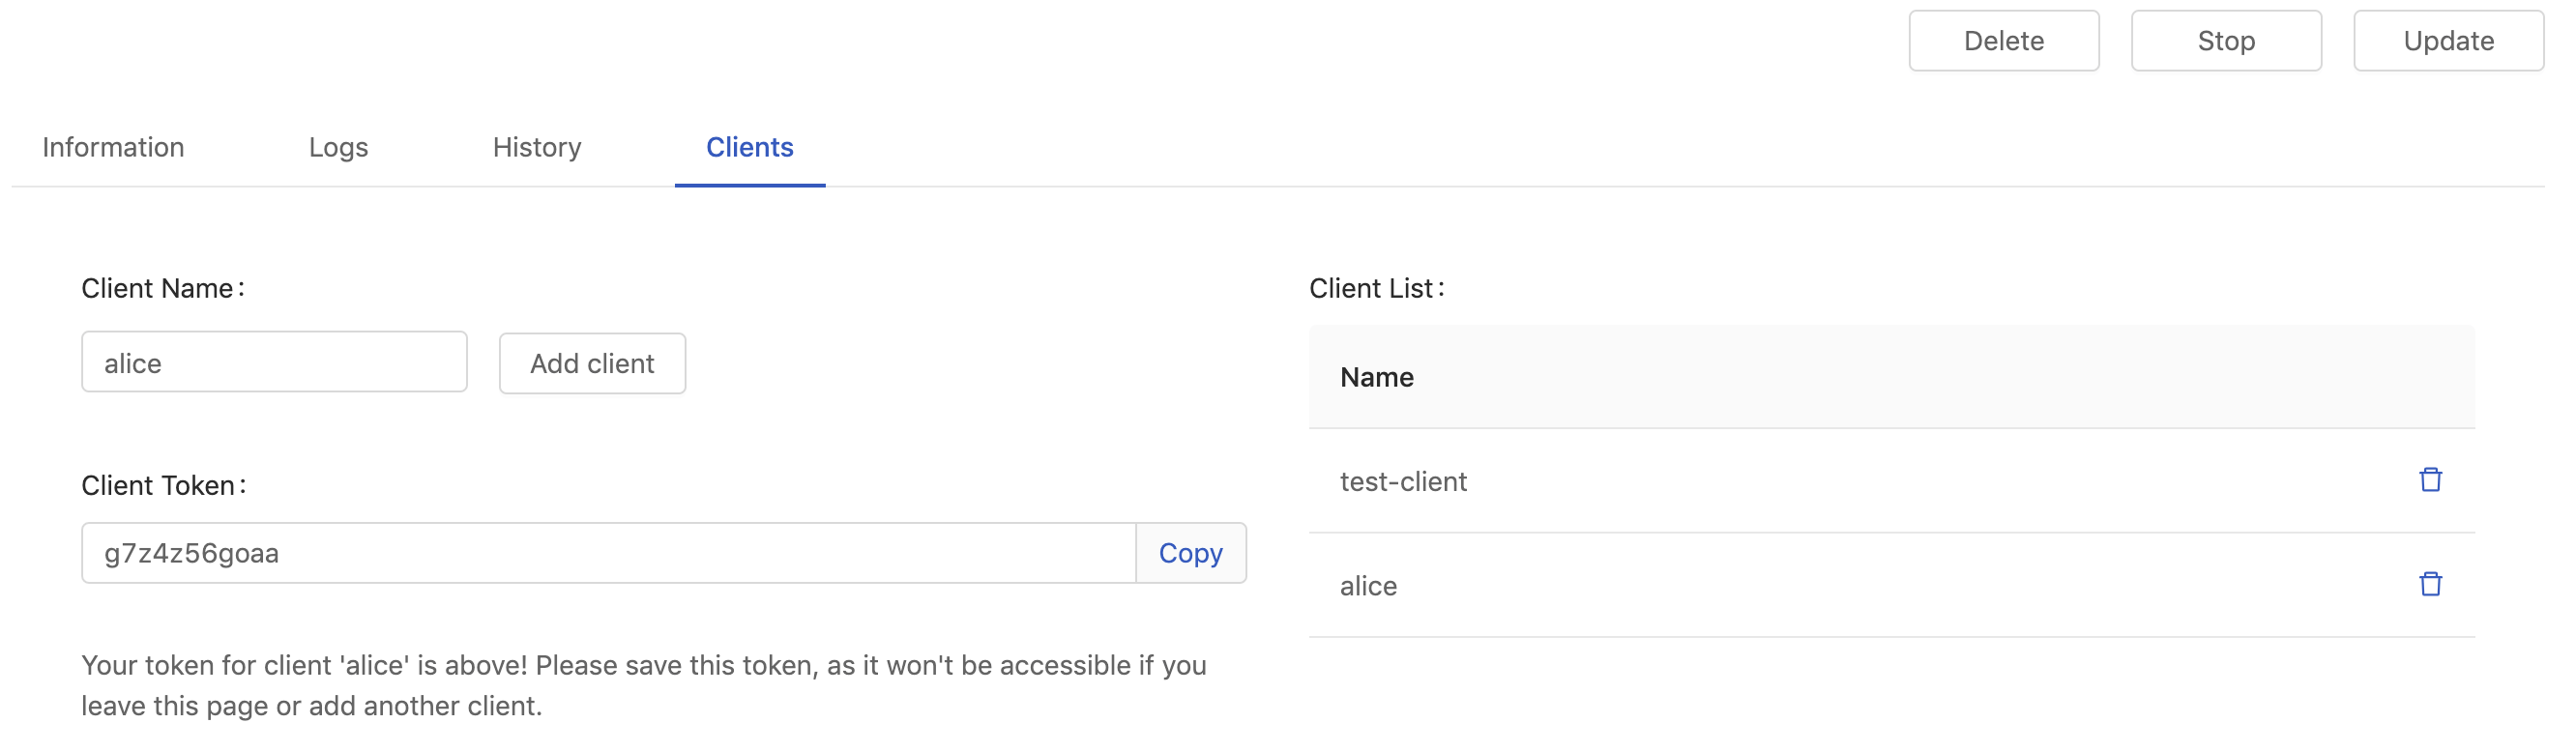
Filling in Client Name and clicking Add client to generate a Client Token.
The token is mandatory for accessing a private endpoint, we can bring it as -u <client-name>:<client-token> in a curl command.
curl -X POST \
    -u <client-name>:<client-token> \
    -d '{"data":{"names":["a","b"],"tensor":{"shape":[2,2],"values":[0,0,1,1]}}}' \
    -H "Content-Type: application/json" \
    https://<primehub>/deployment/<model>/api/<version>/predictions
Client Token displays once only for a short while, please save it. If lost, deleting the record and generate it again.
Tips:
In the predict function of a deployed model, we may want to collect the information of clients who send requests to.
We could learn the info from the header of requests, X-Forwarded-User like the example below.
from flask import request as req

...
req.headers.get('X-Forwarded-User') # you can get the client name from the header
...
Update
On a deployment detail page, clicking Update button to enter the deployment editing.
Group、 Deployment name、 Deployment ID are not allowed to be modified in a update once the initial deployment is created.
Delete
Clicking on the cell of the deployment which we want to delete.
On a deployment detail page, clicking Delete button at top-right for the deployment deletion.
Stop
Clicking on the cell of the deployment which we want to stop.
On a deployment detail page, clicking Stop button at top-right to stop the current deployed service.
Monitor
PrimeHub provides a monitoring dashboard based on Seldon Core Analytics on Grafana, we are able to monitor metrics of deployment/model/model version.
Accessing the Grafana from User Portal.
Selecting
PrimeHub / Model Deploymentsdashboard, it lists deployment which are providing services.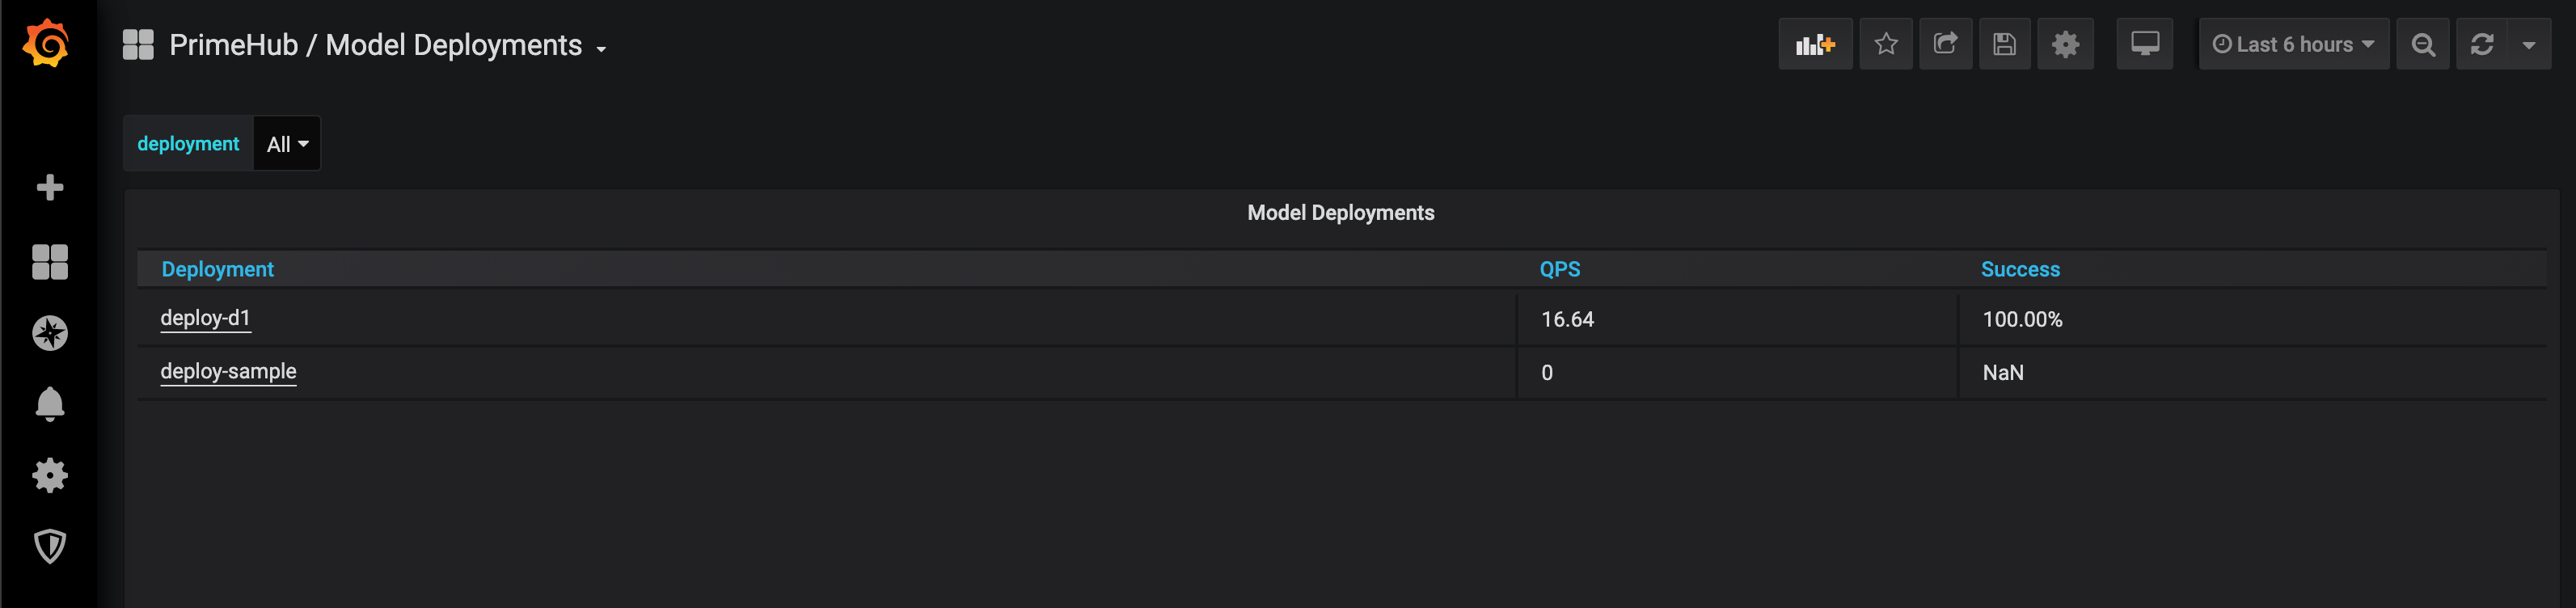
Selecting a deployment and monitoring metrics on the board.
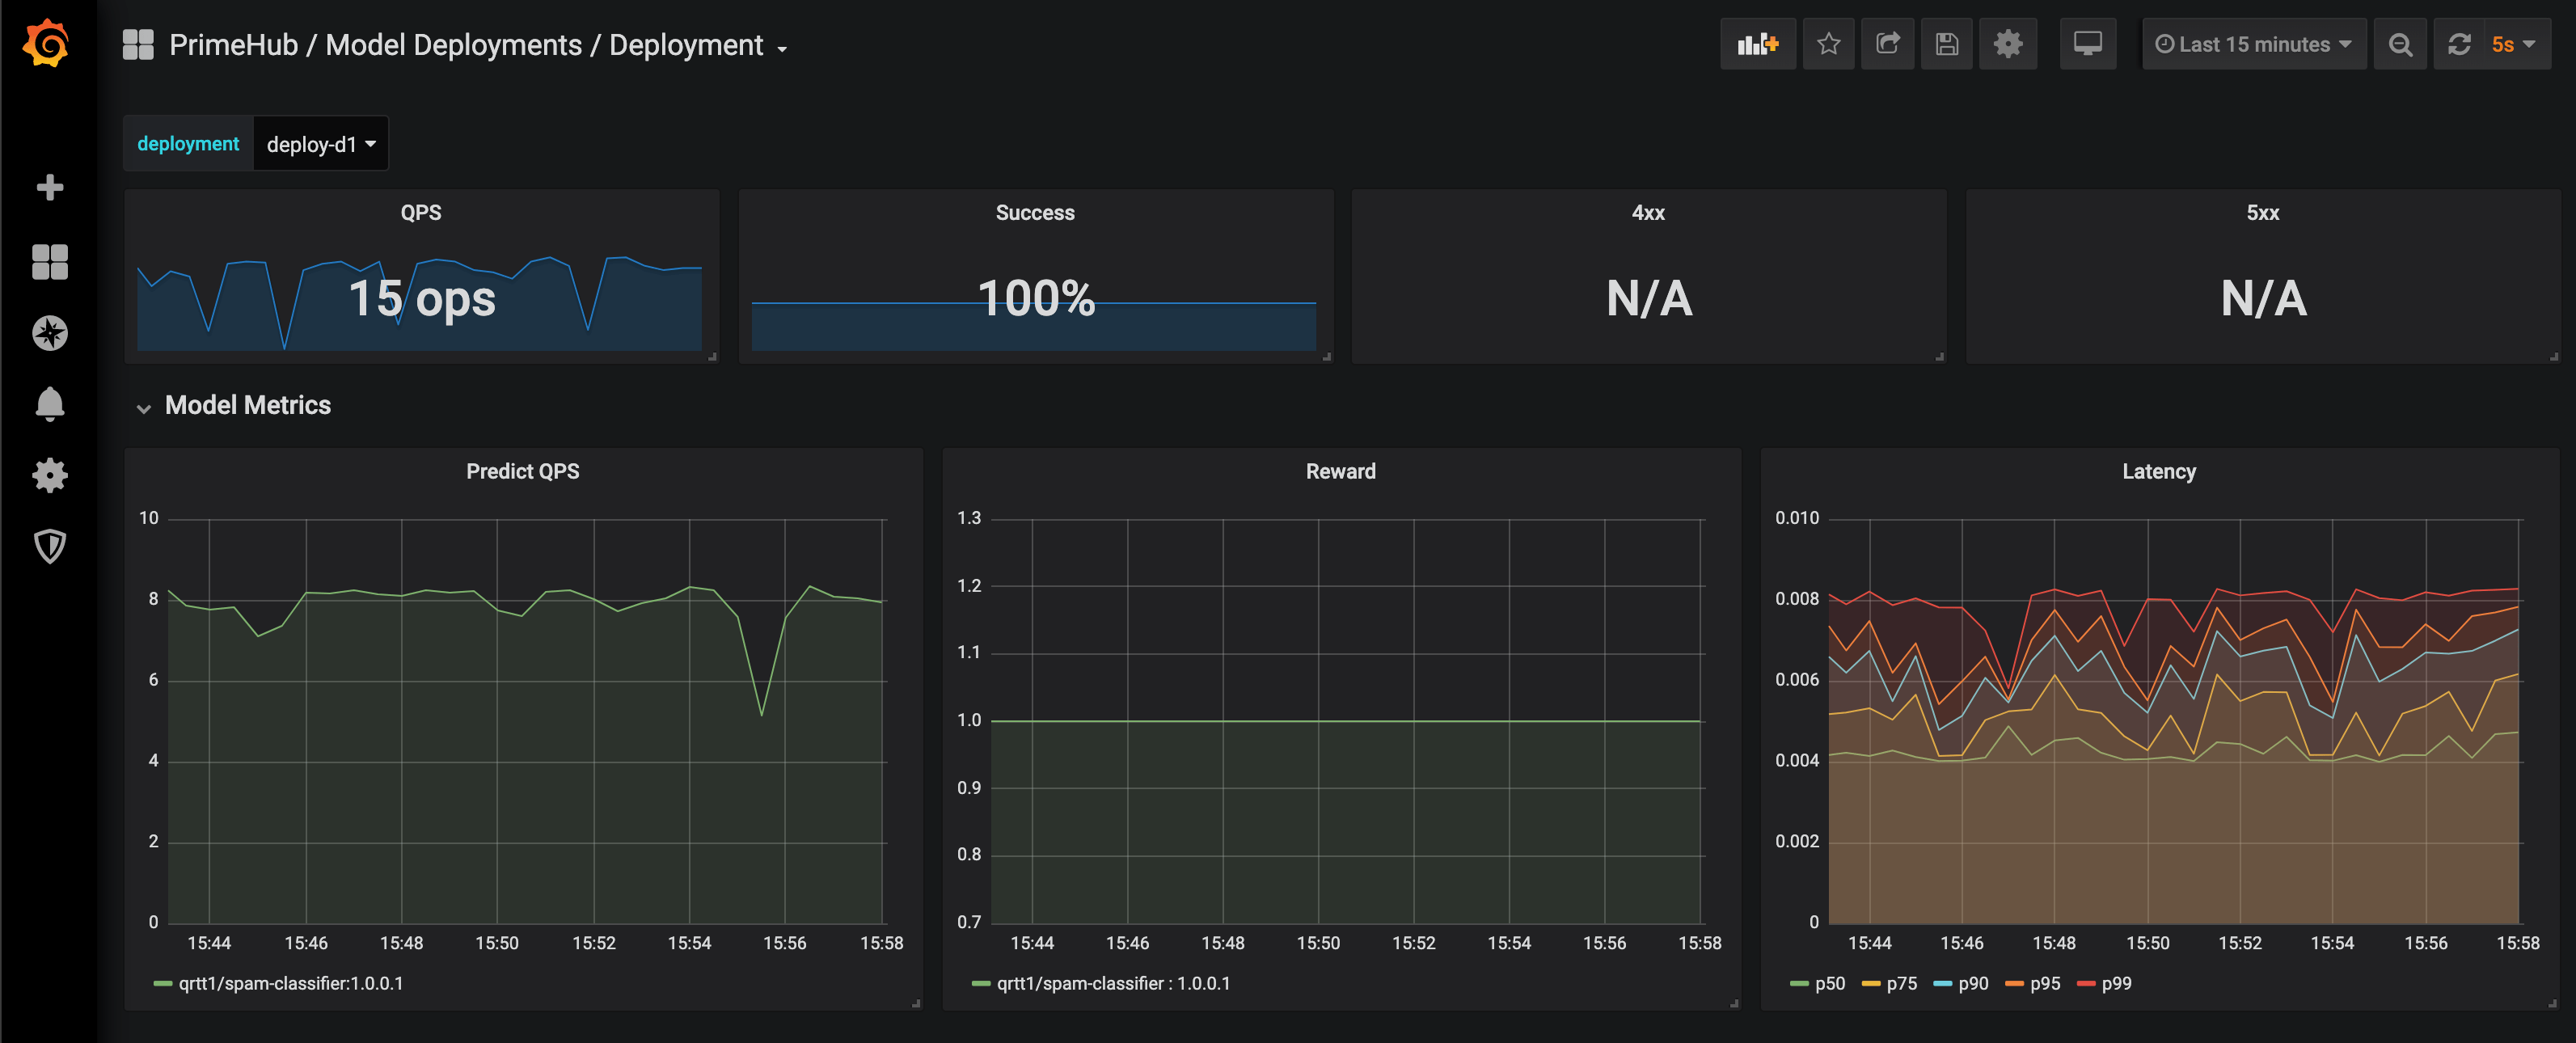
Default Metrics:
QPS (Queries Per Second)
Success rate
4xx, error if any
5xx, error is any
Predict QPS
Reward
The reward is interpreted as the proportion of successes in the batch of data samples. Thus this implementation inherently assumes binary rewards for each sample in the batch. The helper function n_success_failures calculates the number of successes and failures given the batch of data samples and the reward. -Reference.
Latency
The board is based on Seldon Core Analytics, it can be advanced customized. Please see the document and code.